Zynga 2013 Annual Report Download - page 60
Download and view the complete annual report
Please find page 60 of the 2013 Zynga annual report below. You can navigate through the pages in the report by either clicking on the pages listed below, or by using the keyword search tool below to find specific information within the annual report.-
 1
1 -
2
-
3
-
4
-
5
-
6
-
7
-
8
-
9
-
10
-
11
-
12
-
13
-
14
-
15
-
16
-
17
-
18
-
19
-
20
-
21
-
22
-
23
-
24
-
25
-
26
-
27
-
28
-
29
-
30
-
31
-
32
-
33
-
34
-
35
-
36
-
37
-
38
-
39
-
40
-
41
-
42
-
43
-
44
-
45
-
46
-
47
-
48
-
49
-
 50
50 -
 51
51 -
 52
52 -
 53
53 -
 54
54 -
 55
55 -
 56
56 -
 57
57 -
 58
58 -
 59
59 -
 60
60 -
 61
61 -
 62
62 -
 63
63 -
 64
64 -
 65
65 -
 66
66 -
 67
67 -
 68
68 -
 69
69 -
 70
70 -
71
-
72
-
73
-
74
-
75
-
76
-
77
-
78
-
79
-
80
-
81
-
82
-
83
-
84
-
85
-
86
-
87
-
88
-
89
-
90
-
91
-
92
-
93
-
94
-
95
-
96
-
97
-
98
-
99
-
100
-
101
-
102
-
103
-
104
-
105
-
106
-
107
-
108
-
109
-
110
-
111
-
112
-
113
-
114
-
115
-
116
-
117
-
118
-
119
-
120
-
121
-
122
-
123
-
124
-
125
-
126
-
127
-
128
-
129
 |
 |

Table of Contents
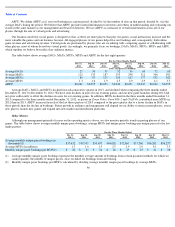
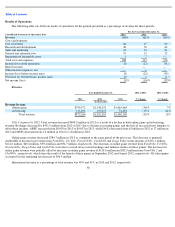
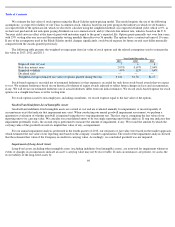
56
For the Three Months Ended
Dec 31,
2013
Sep 30,
2013
Jun 30,
2013
Mar 31,
2013
Dec 31,
2012
Sep 30,
2012
Jun 30,
2012
Mar 31,
2012
(as a percentage of revenue)
Consolidated Statements of
Operations Data:
Revenue
100
%
100
%
100
%
100
%
100
%
100
%
100
%
100
%
Costs and expenses:
Cost of revenue
33
29
26
26
25
28
29
28
Research and development
45
40
54
49
42
49
52
58
Sales and marketing
14
10
14
10
10
12
17
18
General and administrative
24
17
19
17
10
11
14
23
Impairment of intangible
assets
—
5
—
—
—
30
—
—
Total costs and expenses
116
101
113
102
87
130
112
127
Income (loss) from operations
(16
)
(1
)
(13
)
(2
)
13
(30
)
(12
)
(27
)
Net income (loss)
(14
)%
—
(
7
)%
2
%
(16
)%
(17
)%
(7
)%
(27
)%
For the Three Months Ended
Dec 31,
2013
Sep 30,
2013
Jun 30,
2013
Mar 31,
2013
Dec 31,
2012
Sep 30,
2012
Jun 30,
2012
Mar 31,
2012
(dollars in thousands, except ABPU data)
Other Financial and
Operations Data:
Bookings
$
146,677
$
152,106
$
187,578
$
229,815
$
261,269
$
255,606
$
301,588
$
329,164
Adjusted EBITDA
$
2,603
$
6,901
$
8,310
$
28,735
$
45,018
$
16,154
$
65,309
$
86,752
Average DAUs (in millions)
27
30
39
52
56
60
72
65
Average MAUs (in millions)
112
133
187
253
298
311
306
292
Average MUUs (in millions)
80
97
123
150
167
177
192
182
Average MUPs (in millions)
1.3
1.6
1.9
2.5
2.9
2.9
4.1
3.5
ABPU
$
0.060
$
0.055
$
0.053
$
0.049
$
0.051
$
0.047
$
0.046
$
0.055