Zynga 2013 Annual Report Download - page 63
Download and view the complete annual report
Please find page 63 of the 2013 Zynga annual report below. You can navigate through the pages in the report by either clicking on the pages listed below, or by using the keyword search tool below to find specific information within the annual report.-
 1
1 -
2
-
3
-
4
-
5
-
6
-
7
-
8
-
9
-
10
-
11
-
12
-
13
-
14
-
15
-
16
-
17
-
18
-
19
-
20
-
21
-
22
-
23
-
24
-
25
-
26
-
27
-
28
-
29
-
30
-
31
-
32
-
33
-
34
-
35
-
36
-
37
-
38
-
39
-
40
-
41
-
42
-
43
-
44
-
45
-
46
-
47
-
48
-
49
-
50
-
51
-
52
-
 53
53 -
 54
54 -
 55
55 -
 56
56 -
 57
57 -
 58
58 -
 59
59 -
 60
60 -
 61
61 -
 62
62 -
 63
63 -
 64
64 -
 65
65 -
 66
66 -
 67
67 -
 68
68 -
 69
69 -
 70
70 -
 71
71 -
 72
72 -
 73
73 -
74
-
75
-
76
-
77
-
78
-
79
-
80
-
81
-
82
-
83
-
84
-
85
-
86
-
87
-
88
-
89
-
90
-
91
-
92
-
93
-
94
-
95
-
96
-
97
-
98
-
99
-
100
-
101
-
102
-
103
-
104
-
105
-
106
-
107
-
108
-
109
-
110
-
111
-
112
-
113
-
114
-
115
-
116
-
117
-
118
-
119
-
120
-
121
-
122
-
123
-
124
-
125
-
126
-
127
-
128
-
129
 |
 |

Table of Contents
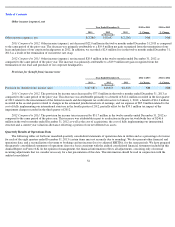
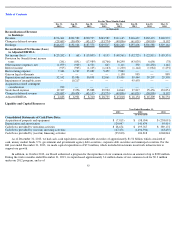
Investing Activities
Investing activities resulted in a cash inflow of $147.5 million during the twelve months ended December 31, 2013. The primary inflows of
cash associated with investing activities were $169.9 million for the sales and maturities of marketable securities, net of purchases. Capital
expenditures were $7.8 million for the twelve months ended December 31, 2013, which mainly related to the investment in our data centers and
other hardware and software to maintain our datacenter infrastructure. We expect capital expenditures of approximately $30 million in 2014.
Investing activities resulted in a cash outflow of $1.5 billion during the twelve months ended December 31, 2012. The primary uses of cash
associated with investing activities were $954 million for the purchase of marketable securities, net of sales and maturities; $233.7 million for
the purchase of our corporate headquarters building and $205.5 million, net of cash acquired, for business acquisitions. Excluding the purchase
of our corporate headquarters building, capital expenditures were $98.1 million for the twelve months ended December 31, 2012, which mainly
related to the continued investment in our data centers and other hardware and software to support our growth.
Cash used in the purchase of marketable securities was $650.0 million in 2011 and $804.5 million in 2010. Cash provided by the sale and
maturity of marketable securities was $860.8 million in 2011 and $324.0 million in 2010. We used $42.8 million and $62.3 million, net of cash
acquired, in connection with acquisitions in 2011 and 2010, respectively.
Financing Activities
For the twelve months ended December 31, 2013, the primary outflow of cash associated with financing activities was $100.0 million for
the repayment of debt and $11.2 million of excess tax costs from stock-based awards. We also had a cash inflow of $18.2 million for cash
received from the exercise of employee stock options and warrants.
For the twelve months ended December 31, 2012, our primary financing activity was $99.8 million in proceeds from a term loan, net of
issuance costs, entered into on June 29, 2012. We also had cash out flows of $26.3 million for tax payments made in connection with the vesting
of stock awards and cash received from the exercise of employee stock options and warrants of $17.0 million.
In 2011, we issued 100 million shares of Class A common stock and 34.9 million shares of Series C preferred stock for net proceeds of
$961.4 million and $485.3 million, respectively. We repurchased 27.5 million shares of our outstanding capital stock for a total purchase price of
$283.8 million and made payments of $83.2 million related to tax withholding obligations and the related net settlement of equity awards during
2011.
Credit Facility
In June 2013, we amended our existing revolving credit agreement which we originally executed in July 2011, reducing our maximum
available credit from $1.0 billion to $200 million, and extending the term through June 2018. Per the terms of our amended agreement, we paid
additional up-front fees of $0.3 million to be amortized over the remaining extended term of the loan. The interest rate for the amended credit
facility is determined based on a formula using certain market rates, as described in the amended credit agreement. Additionally, our minimum
quarterly commitment fee was reduced from $0.6 million per quarter to $0.1 million per quarter based on the portion of the credit facility that is
not drawn down. The agreement requires us to comply with certain covenants, including maintaining a minimum capitalization ratio, and
maintaining a minimum cash balance. As of December 31, 2013, we have not drawn down any amounts under the credit facility and are in
compliance with these covenants.
59