Zynga 2013 Annual Report Download - page 61
Download and view the complete annual report
Please find page 61 of the 2013 Zynga annual report below. You can navigate through the pages in the report by either clicking on the pages listed below, or by using the keyword search tool below to find specific information within the annual report.-
 1
1 -
2
-
3
-
4
-
5
-
6
-
7
-
8
-
9
-
10
-
11
-
12
-
13
-
14
-
15
-
16
-
17
-
18
-
19
-
20
-
21
-
22
-
23
-
24
-
25
-
26
-
27
-
28
-
29
-
30
-
31
-
32
-
33
-
34
-
35
-
36
-
37
-
38
-
39
-
40
-
41
-
42
-
43
-
44
-
45
-
46
-
47
-
48
-
49
-
50
-
 51
51 -
 52
52 -
 53
53 -
 54
54 -
 55
55 -
 56
56 -
 57
57 -
 58
58 -
 59
59 -
 60
60 -
 61
61 -
 62
62 -
 63
63 -
 64
64 -
 65
65 -
 66
66 -
 67
67 -
 68
68 -
 69
69 -
 70
70 -
 71
71 -
72
-
73
-
74
-
75
-
76
-
77
-
78
-
79
-
80
-
81
-
82
-
83
-
84
-
85
-
86
-
87
-
88
-
89
-
90
-
91
-
92
-
93
-
94
-
95
-
96
-
97
-
98
-
99
-
100
-
101
-
102
-
103
-
104
-
105
-
106
-
107
-
108
-
109
-
110
-
111
-
112
-
113
-
114
-
115
-
116
-
117
-
118
-
119
-
120
-
121
-
122
-
123
-
124
-
125
-
126
-
127
-
128
-
129
 |
 |

Table of Contents
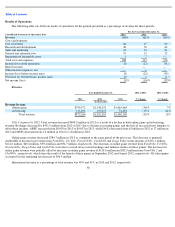
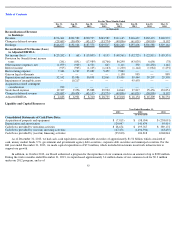
Liquidity and Capital Resources
As of December 31, 2013, we had cash, cash equivalents and marketable securities of approximately $1.54 billion, which consisted of
cash, money market funds, U.S. government and government agency debt securities, corporate debt securities and municipal securities. For the
full year ended December 31, 2013, we made capital expenditures of $7.8 million, which included investments in network infrastructure to
support our growth.
In addition, in October 2012, our Board authorized a program for the repurchase of our common stock in an amount of up to $200 million.
During the twelve months ended December 31, 2013, we repurchased approximately 3.4 million shares of our common stock for $9.3 million
under our 2012 program, and as of
57
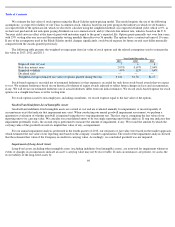
For the Three Months Ended
Dec 31,
2013
Sep 30,
2013
Jun 30,
2013
Mar 31,
2013
Dec 31,
2012
Sep 30,
2012
Jun 30,
2012
Mar 31,
2012
(in thousands)
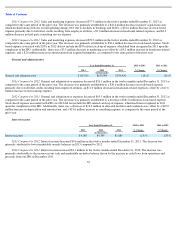
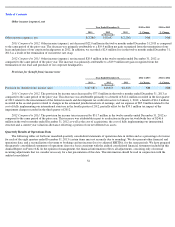
Reconciliation of Revenue
to Bookings:
Revenue
$
176,362
$
202,580
$
230,735
$
263,589
$
311,165
$
316,637
$
332,493
$
320,972
Change in deferred revenue
(29,685
)
(50,474
)
(43,157
)
(33,774
)
(49,896
)
(61,031
)
(30,905
)
8,192
Bookings
$
146,677
$
152,106
$
187,578
$
229,815
$
261,269
$
255,606
$
301,588
$
329,164
Reconciliation of Net Income (Loss)
to Adjusted EBITDA:
Net income (loss)
$
(25,242
)
$
(68
)
$
(15,805
)
$
4,133
$
(48,561
)
$
(52,725
)
$
(22,811
)
$
(85,351
)
Provision for (benefit from) income
taxes
(241
)
(891
)
(17,989
)
(8,766
)
86,290
(43,035
)
6,696
(78
)
Other income (expense), net
(1,079
)
(929
)
4,531
863
1,111
350
(21,250
)
1,142
Interest income
(915
)
(965
)
(1,105
)
(1,163
)
(1,230
)
(1,144
)
(1,084
)
(1,291
)
Restructuring expense
7,366
6,769
25,089
5,459
7,862
—
—
—
Gain on legal settlements
—
—
—
—
1,150
985
—
889
Depreciation and amortization
32,142
33,986
30,858
32,061
33,430
39,444
39,207
29,398
Impairment of intangible assets
—
10,217
—
—
—
95,493
—
—
Acquisition-related contingent
consideration
930
—
—
—
—
—
—
—
Stock
-
based expense
19,327
9,256
25,888
29,922
14,862
37,817
95,456
133,851
Change in deferred revenue
(29,685
)
(50,474
)
(43,157
)
(33,774
)
(49,896
)
(61,031
)
(30,905
)
8,192
Adjusted EBITDA
$
2,603
$
6,901
$
8,310
$
28,735
$
45,018
$
16,154
$
65,309
$
86,752
Year Ended December 31,
2013
2012
2011
(in thousands)
Consolidated Statements of Cash Flows Data:
Acquisition of property and equipment
$
(7,813
)
$
(98,054
)
$
(238,091
)
Depreciation and amortization
129,047
141,479
95,414
Cash flows provided by operating activities
$
28,674
$
195,767
$
389,172
Cash flows provided by (used in) investing activities
147,476
(1,496,934
)
(63,455
)
Cash flows provided by (used in) financing activities
(95,818
)
104,818
1,068,844