Zynga 2013 Annual Report Download - page 89
Download and view the complete annual report
Please find page 89 of the 2013 Zynga annual report below. You can navigate through the pages in the report by either clicking on the pages listed below, or by using the keyword search tool below to find specific information within the annual report.-
 1
1 -
2
-
3
-
4
-
5
-
6
-
7
-
8
-
9
-
10
-
11
-
12
-
13
-
14
-
15
-
16
-
17
-
18
-
19
-
20
-
21
-
22
-
23
-
24
-
25
-
26
-
27
-
28
-
29
-
30
-
31
-
32
-
33
-
34
-
35
-
36
-
37
-
38
-
39
-
40
-
41
-
42
-
43
-
44
-
45
-
46
-
47
-
48
-
49
-
50
-
51
-
52
-
53
-
54
-
55
-
56
-
57
-
58
-
59
-
60
-
61
-
62
-
63
-
64
-
65
-
66
-
67
-
68
-
69
-
70
-
71
-
72
-
73
-
74
-
75
-
76
-
77
-
78
-
 79
79 -
 80
80 -
 81
81 -
 82
82 -
 83
83 -
 84
84 -
 85
85 -
 86
86 -
 87
87 -
 88
88 -
 89
89 -
 90
90 -
 91
91 -
 92
92 -
 93
93 -
 94
94 -
 95
95 -
 96
96 -
 97
97 -
 98
98 -
 99
99 -
100
-
101
-
102
-
103
-
104
-
105
-
106
-
107
-
108
-
109
-
110
-
111
-
112
-
113
-
114
-
115
-
116
-
117
-
118
-
119
-
120
-
121
-
122
-
123
-
124
-
125
-
126
-
127
-
128
-
129
 |
 |

Table of Contents
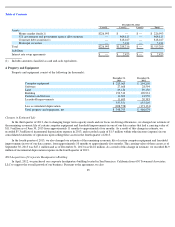
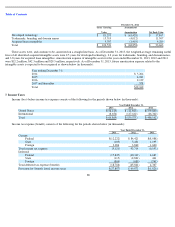
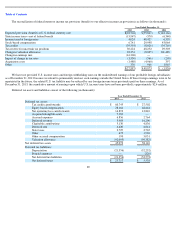
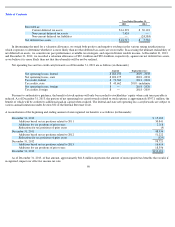
4. Property and Equipment
Property and equipment consist of the following (in thousands):
Changes in Estimated Life
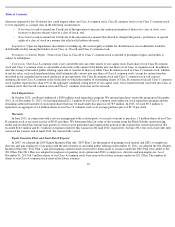
In the third quarter of 2013, due to changing longer term capacity needs and our focus on driving efficiencies, we changed our estimate of
the remaining economic life of certain computer equipment and leasehold improvements in one of our data centers that had a carrying value of
$11.9 million as of June 30, 2013 from approximately 11 months to approximately four months. As a result of this change in estimate, we
recorded $5.3 million of incremental depreciation expense in 2013, and recorded a gain of $1.5 million within other income (expense) in our
consolidated statements of operations upon selling these assets in the fourth quarter of 2013.
In the fourth quarter of 2013, we also changed our estimate of the remaining economic life of certain computer equipment and leasehold
improvements in two of our data centers, from approximately 10 months to approximately five months. The carrying value of these assets as of
September 30, 2013 was $27.1 million and as of December 31, 2013 was $14.6 million. As a result of this change in estimate, we recorded $4.9
million of incremental depreciation expense in the fourth quarter of 2013.
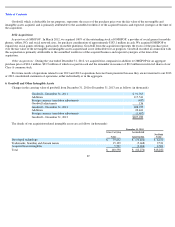
2012 Acquisition of Corporate Headquarters Building
In April, 2012, we purchased our corporate headquarters building located in San Francisco, California from 650 Townsend Associates,
LLC to support the overall growth of our business. Pursuant to the agreement, we also
85
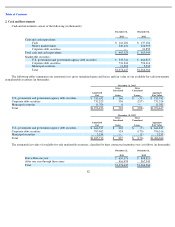
December 31, 2012
Level 1
Level 2
Level 3
Total
Assets:
Money market funds(1)
$
226,993
$
—
$
—
$
226,993
U.S. government and government agency debt securities
—
464,815
—
464,815
Corporate debt securities(1)
—
818,167
—
818,167
Municipal securities
—
5,234
—
5,234
Total
$
226,993
$
1,288,216
$
—
$
1,515,209
Liabilities
Interest rate swap agreements
$
—
$
2,423
$
—
$
2,423
(1)
Includes amounts classified as cash and cash equivalents.
December 31,
December 31,
2013
2012
Computer equipment
$
225,063
$
294,208
Software
27,668
28,594
Land
89,130
89,130
Building
192,512
190,931
Furniture and fixtures
11,303
13,959
Leasehold improvements
11,695
20,383
557,371
637,205
Less accumulated depreciation
(208,578
)
(171,131
)
Total property and equipment, net
$
348,793
$
466,074