Zynga 2013 Annual Report Download - page 58
Download and view the complete annual report
Please find page 58 of the 2013 Zynga annual report below. You can navigate through the pages in the report by either clicking on the pages listed below, or by using the keyword search tool below to find specific information within the annual report.-
 1
1 -
2
-
3
-
4
-
5
-
6
-
7
-
8
-
9
-
10
-
11
-
12
-
13
-
14
-
15
-
16
-
17
-
18
-
19
-
20
-
21
-
22
-
23
-
24
-
25
-
26
-
27
-
28
-
29
-
30
-
31
-
32
-
33
-
34
-
35
-
36
-
37
-
38
-
39
-
40
-
41
-
42
-
43
-
44
-
45
-
46
-
47
-
 48
48 -
 49
49 -
 50
50 -
 51
51 -
 52
52 -
 53
53 -
 54
54 -
 55
55 -
 56
56 -
 57
57 -
 58
58 -
 59
59 -
 60
60 -
 61
61 -
 62
62 -
 63
63 -
 64
64 -
 65
65 -
 66
66 -
 67
67 -
 68
68 -
69
-
70
-
71
-
72
-
73
-
74
-
75
-
76
-
77
-
78
-
79
-
80
-
81
-
82
-
83
-
84
-
85
-
86
-
87
-
88
-
89
-
90
-
91
-
92
-
93
-
94
-
95
-
96
-
97
-
98
-
99
-
100
-
101
-
102
-
103
-
104
-
105
-
106
-
107
-
108
-
109
-
110
-
111
-
112
-
113
-
114
-
115
-
116
-
117
-
118
-
119
-
120
-
121
-
122
-
123
-
124
-
125
-
126
-
127
-
128
-
129
 |
 |

Table of Contents
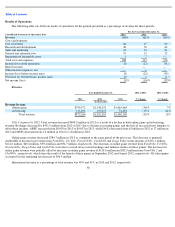
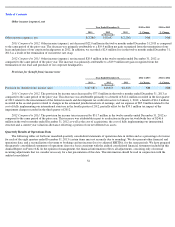
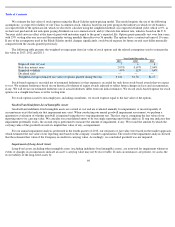
Other income (expense), net
2013 Compared to 2012.
Other income (expense), net decreased $22.0 million in the twelve months ended December 31,2013 as compared
to the same period of the prior year. The decrease was primarily attributable to a $19.9 million net gain recognized from the termination of our
lease and purchase of our corporate headquarters in 2012. In addition, we recorded a $2.4 million loss in the twelve months ended December 31,
2013 as a result of the termination of our interest rate swap.
2012 Compared to 2011. Other income (expense), net increased $20.9 million in the twelve months ended December 31, 2012 as
compared to the same period of the prior year. The increase was primarily attributable to a $19.9 million net gain recognized from the
termination of our lease and purchase of our corporate headquarters.
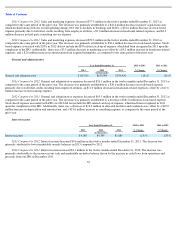
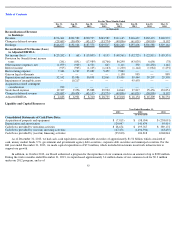
Provision for (benefit from) income taxes
2013 Compared to 2012. The provision for income taxes decreased by $77.8 million in the twelve months ended December 31, 2013 as
compared to the same period of the prior year. This decrease was attributable primarily to a benefit of $12.4 million recorded in the first quarter
of 2013 related to the reinstatement of the federal research and development tax credit retroactive to January 1, 2012, a benefit of $16.3 million
recorded in the second quarter related to changes in the estimated jurisdictional mix of earnings, and tax expense of $85.0 million related to the
cost of fully implementing our international structure in the fourth quarter of 2012, partially offset by the $39.1 million tax impact of the
impairment charges recorded in the third quarter of 2012.
2012 Compared to 2011. The provision for income taxes increased by $51.7 million in the twelve months ended December 31, 2012 as
compared to the same period of the prior year. This increase was attributable in part to a reduction in the pre-tax worldwide loss of $246.6
million in the twelve months ended December 31, 2012 as well as the cost of acquisitions, the cost of fully implementing our international
structure and a current year valuation allowance offsetting a portion of our net deferred tax assets.
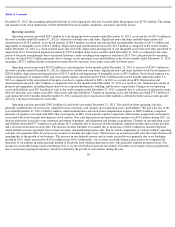
Quarterly Results of Operations Data
The following tables set forth our unaudited quarterly consolidated statements of operations data in dollars and as a percentage of revenue
for each of the eight quarters ended December 31, 2013 (certain items may not reconcile due to rounding). We also present other financial and
operations data, and a reconciliation of revenue to bookings and net income (loss) to adjusted EBITDA, for the same periods. We have prepared
the quarterly consolidated statements of operations data on a basis consistent with the audited consolidated financial statements included in this
Annual Report on Form 10-K. In the opinion of management, the financial information reflects all adjustments, consisting only of normal
recurring adjustments that we consider necessary for a fair presentation of this data. This information should be read in conjunction with the
audited consolidated
54
Year Ended December 31,
2012 to 2013
% Change
2011 to 2012
% Change
2013
2012
2011
(in thousands)
Other income (expense), net
$
(3,386
)
$
18,647
$
(2,206
)
NM
NM
Year Ended December 31,
2012 to 2013
% Change
2011 to 2012
% Change
2013
2012
2011
(in thousands)
Provision for (benefit from) income taxes
$
(27,887
)
$
49,873
$
(1,826
)
NM
NM