Zynga 2013 Annual Report Download - page 73
Download and view the complete annual report
Please find page 73 of the 2013 Zynga annual report below. You can navigate through the pages in the report by either clicking on the pages listed below, or by using the keyword search tool below to find specific information within the annual report.-
 1
1 -
2
-
3
-
4
-
5
-
6
-
7
-
8
-
9
-
10
-
11
-
12
-
13
-
14
-
15
-
16
-
17
-
18
-
19
-
20
-
21
-
22
-
23
-
24
-
25
-
26
-
27
-
28
-
29
-
30
-
31
-
32
-
33
-
34
-
35
-
36
-
37
-
38
-
39
-
40
-
41
-
42
-
43
-
44
-
45
-
46
-
47
-
48
-
49
-
50
-
51
-
52
-
53
-
54
-
55
-
56
-
57
-
58
-
59
-
60
-
61
-
62
-
 63
63 -
 64
64 -
 65
65 -
 66
66 -
 67
67 -
 68
68 -
 69
69 -
 70
70 -
 71
71 -
 72
72 -
 73
73 -
 74
74 -
 75
75 -
 76
76 -
 77
77 -
 78
78 -
 79
79 -
 80
80 -
 81
81 -
 82
82 -
 83
83 -
84
-
85
-
86
-
87
-
88
-
89
-
90
-
91
-
92
-
93
-
94
-
95
-
96
-
97
-
98
-
99
-
100
-
101
-
102
-
103
-
104
-
105
-
106
-
107
-
108
-
109
-
110
-
111
-
112
-
113
-
114
-
115
-
116
-
117
-
118
-
119
-
120
-
121
-
122
-
123
-
124
-
125
-
126
-
127
-
128
-
129
 |
 |
Table of Contents
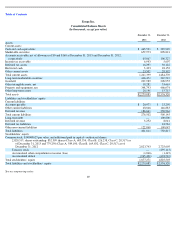
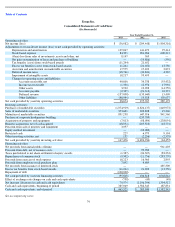
Zynga Inc.
Consolidated Balance Sheets
(In thousands, except par value)
See accompanying notes.
69
December 31,
2013
December 31,
2012
Assets
Current assets:
Cash and cash equivalents
$
465,523
$
385,949
Marketable securities
659,973
898,821
Accounts receivable, net of allowance of $0 and $160 at December 31, 2013 and December 31, 2012,
respectively
65,667
106,327
Income tax receivable
6,943
5,607
Deferred tax assets
16,293
30,122
Restricted cash
3,493
28,152
Other current assets
23,507
29,392
Total current assets
1,241,399
1,484,370
Long
-
term marketable securities
416,474
367,543
Goodwill
227,989
208,955
Other intangible assets, net
18,282
33,663
Property and equipment, net
348,793
466,074
Other long
-
term assets
26,148
15,715
Total assets
$
2,279,085
$
2,576,320
Liabilities and stockholders
’
equity
Current liabilities:
Accounts payable
$
20,973
$
23,298
Other current liabilities
68,866
146,883
Deferred revenue
186,663
338,964
Total current liabilities
276,502
509,145
Long
-
term debt
—
100,000
Deferred revenue
3,252
8,041
Deferred tax liabilities
—
24,584
Other non
-
current liabilities
122,060
109,047
Total liabilities
401,814
750,817
Stockholders
’
equity:
Common stock, $.00000625 par value, and additional paid in capital
—
authorized shares:
2,020,517; shares outstanding: 832,309 shares (Class A, 685,554, Class B, 126,238, Class C, 20,517) as
of December 31, 2013 and 779,250 (Class A, 589,100, Class B, 169,632, Class C, 20,517) as of
December 31, 2012
2,823,743
2,725,605
Treasury stock
—
(
295,113
)
Accumulated other comprehensive income (loss)
(1,046
)
(1,447
)
Accumulated deficit
(945,426
)
(603,542
)
Total stockholders
’
equity
1,877,271
1,825,503
Total liabilities and stockholders
’
equity
$
2,279,085
$
2,576,320