Zynga 2013 Annual Report Download - page 55
Download and view the complete annual report
Please find page 55 of the 2013 Zynga annual report below. You can navigate through the pages in the report by either clicking on the pages listed below, or by using the keyword search tool below to find specific information within the annual report.-
 1
1 -
2
-
3
-
4
-
5
-
6
-
7
-
8
-
9
-
10
-
11
-
12
-
13
-
14
-
15
-
16
-
17
-
18
-
19
-
20
-
21
-
22
-
23
-
24
-
25
-
26
-
27
-
28
-
29
-
30
-
31
-
32
-
33
-
34
-
35
-
36
-
37
-
38
-
39
-
40
-
41
-
42
-
43
-
44
-
 45
45 -
 46
46 -
 47
47 -
 48
48 -
 49
49 -
 50
50 -
 51
51 -
 52
52 -
 53
53 -
 54
54 -
 55
55 -
 56
56 -
 57
57 -
 58
58 -
 59
59 -
 60
60 -
 61
61 -
 62
62 -
 63
63 -
 64
64 -
 65
65 -
66
-
67
-
68
-
69
-
70
-
71
-
72
-
73
-
74
-
75
-
76
-
77
-
78
-
79
-
80
-
81
-
82
-
83
-
84
-
85
-
86
-
87
-
88
-
89
-
90
-
91
-
92
-
93
-
94
-
95
-
96
-
97
-
98
-
99
-
100
-
101
-
102
-
103
-
104
-
105
-
106
-
107
-
108
-
109
-
110
-
111
-
112
-
113
-
114
-
115
-
116
-
117
-
118
-
119
-
120
-
121
-
122
-
123
-
124
-
125
-
126
-
127
-
128
-
129
 |
 |

Table of Contents
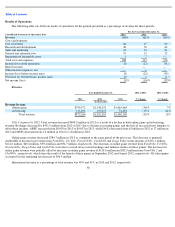
In 2013, Zynga Poker, FarmVille 2 and FarmVille were our top three revenue-generating games and comprised 21%, 17%, and 16%,
respectively, of our online game revenue for the period. No other game generated more than 10% of online game revenue during the year.
Consumable virtual goods accounted for 29% and 30% of online game revenue 2013 and 2012, respectively. Durable virtual goods
accounted for 71% and 70% of online game revenue in 2013 and 2012, respectively. The estimated weighted-average life of durable virtual
goods was 12 months in 2013 and 2012. In addition, changes in our estimated average life of durable virtual goods during 2013 for various
games resulted in an increase in revenue of $12.3 million in that period, which is the result of adjusting the remaining recognition period of
deferred revenue generated in prior periods at the time of a change in estimate. For 2012, changes in our estimated average life of durable virtual
goods resulted in an increase in revenue of $14.1 million.
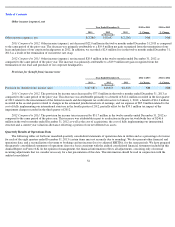
Advertising revenue decreased $23.3 million from 2012 to 2013, due to a $14.1 million decrease in in-game sponsorships, a $6.0 million
decrease in in-game offers, engagement ads and other advertising revenue and a $3.4 million decrease in licensing revenue, offset by an increase
of $0.2 million from in-game display ads. These declines may be attributed to declines in our DAUs in 2013.
2012 Compared to 2011. Total revenue increased $141.2 million in 2012 as a result of growth in both online game and advertising
revenue. Bookings decreased by $7.9 million from 2011 to 2012. ABPU decreased from $0.055 from 2011 to $0.050 in 2012. DAUs increased
from 57 million in 2011 to 63 million in 2012.
Online game revenue increased $78.6 million in 2012 as compared to the same period of the prior year. This increase is primarily
attributable to increases in revenue from CastleVille, Zynga Poker, Hidden Chronicles and FarmVille 2 in the amounts of $98.3 million, $55.2
million, $29.6 million, and $12.1 million, respectively. The increases in online game revenue from CastleVille, Hidden Chronicles and Farmville
2 were the result of these games’
more recent launch dates in November 2011, February 2012, and September 2012, respectively. The increase in
online game revenue from Zynga Poker was mainly due to bookings growth on mobile platforms. The growth in online game revenue was
partially offset by decreases in online game revenue of $90.9 million and $77.4 million from Mafia Wars and FrontierVille, respectively which
was primarily due to an overall decrease in bookings driven by a shift in players to newer games. In addition, $18.2 million of the decrease in
online game revenue from FrontierVille was due to changes in our estimated average life of durable virtual goods during 2011 which resulted in
higher revenue in 2011. All other games accounted for the remaining net increase of $51.7 million.
International revenue as a percentage of total revenue was 41% and 36% in 2012 and 2011, respectively.
In 2012 , FarmVille , Zynga Poker and CityVille , were our top revenue-generating games and comprised 24%, 19%, and 12%,
respectively, of our online game revenue for the period. No other game generated more than 10% of online game revenue during the year.
Consumable virtual goods accounted for 30% and 29% of online game revenue 2012 and 2011, respectively. Durable virtual goods
accounted for 70% and 71% of online game revenue in 2012 and 2011, respectively. The estimated weighted-average life of durable virtual
goods was 12 months in 2012 compared to 15 months in 2011. In addition, changes in our estimated average life of durable virtual goods during
2012 for various games resulted in an increase in revenue of $14.1 million in that period, which is the result of adjusting the remaining
recognition period of deferred revenue generated in prior periods at the time of a change in estimate. For 2011, changes in our estimated average
life of durable virtual goods resulted in an increase in revenue of $53.9 million.
Advertising revenue increased $62.6 million from 2011 to 2012 due to a $62.3 million increase in in-game display ads, a $7.9 million
increase in licensing revenue, and a $9.0 million increase in in-game sponsorship
51