Zynga 2013 Annual Report Download - page 57
Download and view the complete annual report
Please find page 57 of the 2013 Zynga annual report below. You can navigate through the pages in the report by either clicking on the pages listed below, or by using the keyword search tool below to find specific information within the annual report.-
 1
1 -
2
-
3
-
4
-
5
-
6
-
7
-
8
-
9
-
10
-
11
-
12
-
13
-
14
-
15
-
16
-
17
-
18
-
19
-
20
-
21
-
22
-
23
-
24
-
25
-
26
-
27
-
28
-
29
-
30
-
31
-
32
-
33
-
34
-
35
-
36
-
37
-
38
-
39
-
40
-
41
-
42
-
43
-
44
-
45
-
46
-
 47
47 -
 48
48 -
 49
49 -
 50
50 -
 51
51 -
 52
52 -
 53
53 -
 54
54 -
 55
55 -
 56
56 -
 57
57 -
 58
58 -
 59
59 -
 60
60 -
 61
61 -
 62
62 -
 63
63 -
 64
64 -
 65
65 -
 66
66 -
 67
67 -
68
-
69
-
70
-
71
-
72
-
73
-
74
-
75
-
76
-
77
-
78
-
79
-
80
-
81
-
82
-
83
-
84
-
85
-
86
-
87
-
88
-
89
-
90
-
91
-
92
-
93
-
94
-
95
-
96
-
97
-
98
-
99
-
100
-
101
-
102
-
103
-
104
-
105
-
106
-
107
-
108
-
109
-
110
-
111
-
112
-
113
-
114
-
115
-
116
-
117
-
118
-
119
-
120
-
121
-
122
-
123
-
124
-
125
-
126
-
127
-
128
-
129
 |
 |

Table of Contents
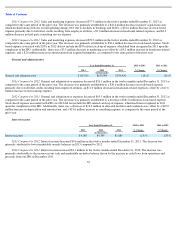
2013 Compared to 2012. Sales and marketing expenses decreased $77.5 million in the twelve months ended December 31, 2013 as
compared to the same period of the prior year. The decrease was primarily attributable to a $41.6 million decrease in player acquisition costs
which declined along with our overall spending during 2013 due to declines in bookings and DAUs, a $16.6 million decrease in stock-based
expense primarily due to forfeiture credits resulting from employee attrition, a $9.0 million decrease in headcount related expenses, and $4.3
million decrease in third party consulting service expense.
2012 Compared to 2011. Sales and marketing expenses decreased $52.3 million in the twelve months ended December 31, 2012 as
compared to the same period of the prior year. The decrease was primarily attributable to $56.6 million decrease in stock-based expense. Stock-
based expense associated with ZSUs in 2012 did not include the IPO related catch-up of expense, which had been recognized in 2011 upon the
completion of the IPO. Additionally, there was a $3.5 million decrease in marketing costs offset by a $4.2 million increase in headcount-related
expenses, and a $2.6 million increase in amortization from acquired intangibles, as compared to the same period of the prior year.
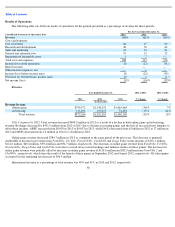
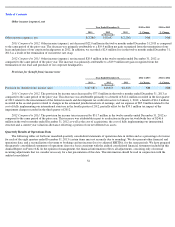
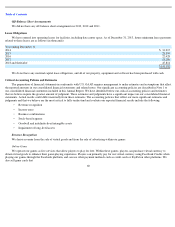
General and administrative
2013 Compared to 2012. General and administrative expenses decreased $26.1 million in the twelve months ended December 31, 2013 as
compared to the same period of the prior year. The decrease was primarily attributable to a $30.6 million decrease in stock-based expense
primarily due to forfeiture credits resulting from employee attrition, an $11.0 million decrease in headcount-related expenses, offset by a $17.6
million increase in restructuring expense.
2012 Compared to 2011. General and administrative expenses decreased $65.5 million in the twelve months ended December 31, 2012 as
compared to the same period of the prior year. The decrease was primarily attributable to a decrease of $81.8 million in stock-based expense.
Stock-based expense associated with ZSUs in 2012 did not include the IPO related catch-up of expense, which had been recognized in 2011
upon the completion of the IPO. Additionally, there was a decrease of $10.2 million in allocated facilities and overhead costs, offset by a $12.0
million increase in depreciation and amortization, and a $15.6 million increase in consulting expense, as compared to the same period of the
prior year.
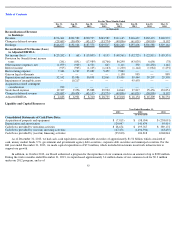
Interest income
2013 Compared to 2012. Interest income decreased $0.6 million in the twelve months ended December 31, 2013. The decrease was
primarily attributed to lower marketable security balances in 2013 compared to 2012.
2012 Compared to 2011. Interest income increased $3.1 million in the twelve months ended December 31, 2012. The increase was
primarily attributable to the increase in our cash and marketable securities balance driven by the increase in cash flows from operations and
proceeds from our IPO in December 2011.
53
Year Ended December 31,
2012 to 2013
% Change
2011 to 2012
% Change
2013
2012
2011
(in thousands)
General and administrative
$
162,918
$
189,004
$
254,456
(14
)%
(26
)%
Year Ended December 31,
2012 to 2013
% Change
2011 to 2012
% Change
2013
2012
2011
(in thousands)
Interest income
$
4,148
$
4,749
$
1,680
(13
)%
183
%