Zynga 2013 Annual Report Download - page 92
Download and view the complete annual report
Please find page 92 of the 2013 Zynga annual report below. You can navigate through the pages in the report by either clicking on the pages listed below, or by using the keyword search tool below to find specific information within the annual report.-
 1
1 -
2
-
3
-
4
-
5
-
6
-
7
-
8
-
9
-
10
-
11
-
12
-
13
-
14
-
15
-
16
-
17
-
18
-
19
-
20
-
21
-
22
-
23
-
24
-
25
-
26
-
27
-
28
-
29
-
30
-
31
-
32
-
33
-
34
-
35
-
36
-
37
-
38
-
39
-
40
-
41
-
42
-
43
-
44
-
45
-
46
-
47
-
48
-
49
-
50
-
51
-
52
-
53
-
54
-
55
-
56
-
57
-
58
-
59
-
60
-
61
-
62
-
63
-
64
-
65
-
66
-
67
-
68
-
69
-
70
-
71
-
72
-
73
-
74
-
75
-
76
-
77
-
78
-
79
-
80
-
81
-
 82
82 -
 83
83 -
 84
84 -
 85
85 -
 86
86 -
 87
87 -
 88
88 -
 89
89 -
 90
90 -
 91
91 -
 92
92 -
 93
93 -
 94
94 -
 95
95 -
 96
96 -
 97
97 -
 98
98 -
 99
99 -
 100
100 -
 101
101 -
 102
102 -
103
-
104
-
105
-
106
-
107
-
108
-
109
-
110
-
111
-
112
-
113
-
114
-
115
-
116
-
117
-
118
-
119
-
120
-
121
-
122
-
123
-
124
-
125
-
126
-
127
-
128
-
129
 |
 |

Table of Contents
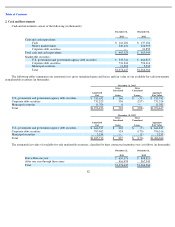
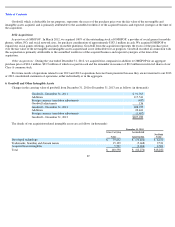
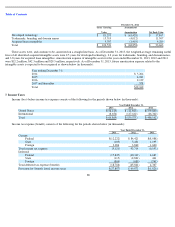
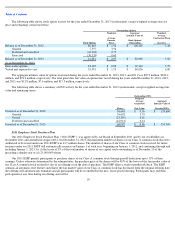
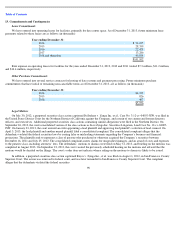
These assets were, and continue to be, amortized on a straight-line basis. As of December 31, 2013, the weighted-
average remaining useful
lives of all identified acquired intangible assets were 2.5 years for developed technology, 2.2 years for trademarks, branding, and domain names,
and 3.8 years for acquired lease intangibles. Amortization expense of intangible assets for the years ended December 31, 2013, 2012 and 2011
were $12.2 million, $42.3 million and $29.5 million, respectively. As of December 31, 2013, future amortization expense related to the
intangible assets is expected to be recognized as shown below (in thousands):
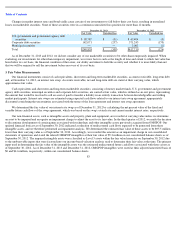
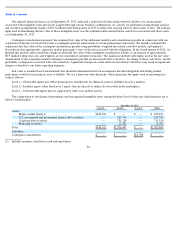
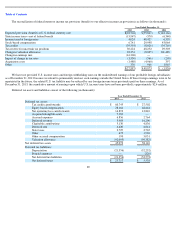
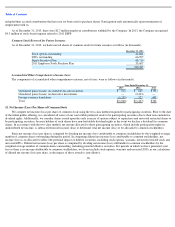
7. Income Taxes
Income (loss) before income tax expense consists of the following for the periods shown below (in thousands):
Income tax expense (benefit) consists of the following for the periods shown below (in thousands):
88
December 31, 2012
Gross Carrying
Value
Accumulated
Amortization
Net Book Value
Developed technology
$
81,295
$
(63,428
)
$
17,867
Trademarks, branding and domain names
15,519
(4,012
)
11,507
Acquired lease intangibles
5,707
(1,418
)
4,289
Total
$
102,521
$
(68,858
)
$
33,663
Year ending December 31:
2014
$
5,264
2015
4,181
2016
2,139
2017 and thereafter
578
Total
$
12,162
Year Ended December 31,
2013
2012
2011
United States
$
(56,215
)
$
(41,963
)
$
(379,800
)
International
(8,654
)
(117,612
)
(26,342
)
Total
$
(64,869
)
$
(159,575
)
$
(406,142
)
Year Ended December 31,
2013
2012
2011
Current:
Federal
$
(12,222
)
$
84,421
$
(8,988
)
State
(105
)
5,431
1,195
Foreign
3,206
3,862
1,600
Total current tax expense
(9,121
)
93,714
(6,193
)
Deferred:
Federal
(17,847
)
(40,331
)
4,687
State
(115
)
(2,821
)
441
Foreign
(804
)
(689
)
(761
)
Total deferred tax expense (benefit)
(18,766
)
(43,841
)
4,367
Provision for (benefit from) income taxes
$
(27,887
)
$
49,873
$
(1,826
)