Zynga 2013 Annual Report Download - page 86
Download and view the complete annual report
Please find page 86 of the 2013 Zynga annual report below. You can navigate through the pages in the report by either clicking on the pages listed below, or by using the keyword search tool below to find specific information within the annual report.-
 1
1 -
2
-
3
-
4
-
5
-
6
-
7
-
8
-
9
-
10
-
11
-
12
-
13
-
14
-
15
-
16
-
17
-
18
-
19
-
20
-
21
-
22
-
23
-
24
-
25
-
26
-
27
-
28
-
29
-
30
-
31
-
32
-
33
-
34
-
35
-
36
-
37
-
38
-
39
-
40
-
41
-
42
-
43
-
44
-
45
-
46
-
47
-
48
-
49
-
50
-
51
-
52
-
53
-
54
-
55
-
56
-
57
-
58
-
59
-
60
-
61
-
62
-
63
-
64
-
65
-
66
-
67
-
68
-
69
-
70
-
71
-
72
-
73
-
74
-
75
-
 76
76 -
 77
77 -
 78
78 -
 79
79 -
 80
80 -
 81
81 -
 82
82 -
 83
83 -
 84
84 -
 85
85 -
 86
86 -
 87
87 -
 88
88 -
 89
89 -
 90
90 -
 91
91 -
 92
92 -
 93
93 -
 94
94 -
 95
95 -
 96
96 -
97
-
98
-
99
-
100
-
101
-
102
-
103
-
104
-
105
-
106
-
107
-
108
-
109
-
110
-
111
-
112
-
113
-
114
-
115
-
116
-
117
-
118
-
119
-
120
-
121
-
122
-
123
-
124
-
125
-
126
-
127
-
128
-
129
 |
 |

Table of Contents
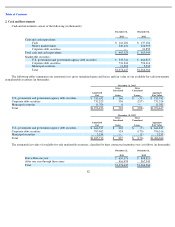
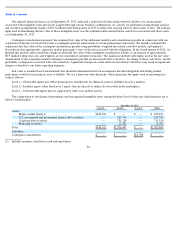
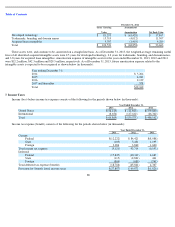
2. Cash and Investments
Cash and investments consist of the following (in thousands):
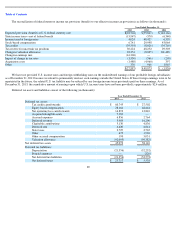
The following tables summarize our amortized cost, gross unrealized gains and losses and fair value of our available-for-sale investments
in marketable securities (in thousands):
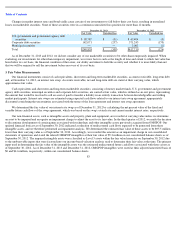
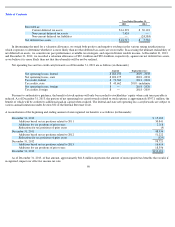
The estimated fair value of available-for-
sale marketable securities, classified by their contractual maturities was as follows (in thousands):
82
December 31,
2013
December 31,
2012
Cash and cash equivalents:
Cash
$
116,102
$
137,104
Money market funds
349,421
226,993
Corporate debt securities
—
21,852
Total cash and cash equivalents
$
465,523
$
385,949
Marketable securities:
U.S. government and government agency debt securities
$
333,741
$
464,815
Corporate debt securities
731,324
796,316
Municipal securities
11,382
5,233
Total
$
1,076,447
$
1,266,364
December 31, 2013
Amortized
Cost
Gross
Unrealized
Gains
Gross
Unrealized
Losses
Aggregate
Fair Value
U.S. government and government agency debt securities
$
333,632
$
160
$
(51
)
$
333,741
Corporate debt securities
731,225
356
(257
)
731,324
Municipal securities
11,376
6
—
11,382
Total
$
1,076,233
$
522
$
(308
)
$
1,076,447
December 31, 2012
Amortized
Cost
Gross
Unrealized
Gains
Gross
Unrealized
Losses
Aggregate
Fair Value
U.S. government and government agency debt securities
$
464,517
$
303
$
(5
)
$
464,815
Corporate debt securities
795,962
524
(170
)
796,316
Municipal securities
5,234
—
(
1
)
5,233
Total
$
1,265,713
$
827
$
(176
)
$
1,266,364
December 31,
2013
December 31,
2012
Due within one year
$
659,973
$
898,821
After one year through three years
416,474
367,543
Total
$
1,076,447
$
1,266,364