Zynga 2013 Annual Report Download - page 77
Download and view the complete annual report
Please find page 77 of the 2013 Zynga annual report below. You can navigate through the pages in the report by either clicking on the pages listed below, or by using the keyword search tool below to find specific information within the annual report.-
 1
1 -
2
-
3
-
4
-
5
-
6
-
7
-
8
-
9
-
10
-
11
-
12
-
13
-
14
-
15
-
16
-
17
-
18
-
19
-
20
-
21
-
22
-
23
-
24
-
25
-
26
-
27
-
28
-
29
-
30
-
31
-
32
-
33
-
34
-
35
-
36
-
37
-
38
-
39
-
40
-
41
-
42
-
43
-
44
-
45
-
46
-
47
-
48
-
49
-
50
-
51
-
52
-
53
-
54
-
55
-
56
-
57
-
58
-
59
-
60
-
61
-
62
-
63
-
64
-
65
-
66
-
 67
67 -
 68
68 -
 69
69 -
 70
70 -
 71
71 -
 72
72 -
 73
73 -
 74
74 -
 75
75 -
 76
76 -
 77
77 -
 78
78 -
 79
79 -
 80
80 -
 81
81 -
 82
82 -
 83
83 -
 84
84 -
 85
85 -
 86
86 -
 87
87 -
88
-
89
-
90
-
91
-
92
-
93
-
94
-
95
-
96
-
97
-
98
-
99
-
100
-
101
-
102
-
103
-
104
-
105
-
106
-
107
-
108
-
109
-
110
-
111
-
112
-
113
-
114
-
115
-
116
-
117
-
118
-
119
-
120
-
121
-
122
-
123
-
124
-
125
-
126
-
127
-
128
-
129
 |
 |

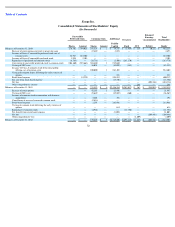
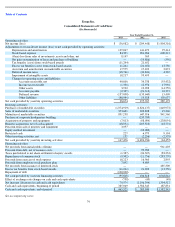
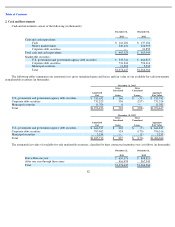
Table of Contents
Zynga Inc.
Consolidated Statements of Stockholders’ Equity (continued)
(In thousands)
73
Common Stock
Additional
Paid-In
Capital
Treasury
Stock
OCI
Retained
Earnings
(Accumulated
Deficit)
Total
Stockholders
Equity
Shares
Amount
Balances at December 31, 2012
779,249
$
5
$
2,725,600
$
(295,113
)
$
(1,447
)
$
(603,542
)
$
1,825,503
Exercise of stock options, warrants, and ESPP
34,020
—
26,115
—
—
—
26,115
Vesting of ZSUs, net
22,914
—
(
901
)
(486
)
—
—
(
1,387
)
Cancellation of unvested restricted common stock
(502
)
—
—
—
—
—
—
Stock
-
based expense
—
—
84,393
—
—
—
84,393
Vesting of common stock following the early exercise of options
—
—
363
—
—
—
363
Retirement of treasury stock, net of repurchases
(3,372
)
—
—
295,599
—
(
304,902
)
(9,303
)
Tax benefit from stock
-
based expense
—
(
11,832
)
—
(
11,832
)
Net loss
—
—
—
—
—
(
36,982
)
(36,982
)
Other comprehensive income
—
—
—
—
401
—
401
Balances at December 31, 2013
832,309
$
5
$
2,823,738
$
—
$
(
1,046
)
$
(945,426
)
$
1,877,271