Zynga 2013 Annual Report Download - page 41
Download and view the complete annual report
Please find page 41 of the 2013 Zynga annual report below. You can navigate through the pages in the report by either clicking on the pages listed below, or by using the keyword search tool below to find specific information within the annual report.-
 1
1 -
2
-
3
-
4
-
5
-
6
-
7
-
8
-
9
-
10
-
11
-
12
-
13
-
14
-
15
-
16
-
17
-
18
-
19
-
20
-
21
-
22
-
23
-
24
-
25
-
26
-
27
-
28
-
29
-
30
-
 31
31 -
 32
32 -
 33
33 -
 34
34 -
 35
35 -
 36
36 -
 37
37 -
 38
38 -
 39
39 -
 40
40 -
 41
41 -
 42
42 -
 43
43 -
 44
44 -
 45
45 -
 46
46 -
 47
47 -
 48
48 -
 49
49 -
 50
50 -
 51
51 -
52
-
53
-
54
-
55
-
56
-
57
-
58
-
59
-
60
-
61
-
62
-
63
-
64
-
65
-
66
-
67
-
68
-
69
-
70
-
71
-
72
-
73
-
74
-
75
-
76
-
77
-
78
-
79
-
80
-
81
-
82
-
83
-
84
-
85
-
86
-
87
-
88
-
89
-
90
-
91
-
92
-
93
-
94
-
95
-
96
-
97
-
98
-
99
-
100
-
101
-
102
-
103
-
104
-
105
-
106
-
107
-
108
-
109
-
110
-
111
-
112
-
113
-
114
-
115
-
116
-
117
-
118
-
119
-
120
-
121
-
122
-
123
-
124
-
125
-
126
-
127
-
128
-
129
 |
 |
Table of Contents
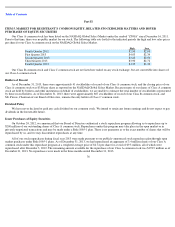
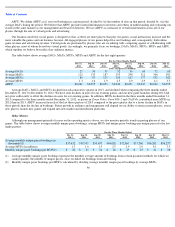
The following table provides information with respect to our repurchases of 3.4 million shares of our Class A common stock during 2012
and 2013:
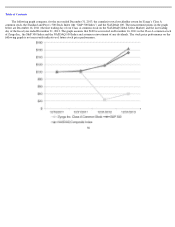
Stock Performance Graph
This performance graph shall not be deemed “filed” for purposes of Section 18 of the Securities Exchange Act of 1934, as amended (the
“Exchange Act”), or otherwise subject to liabilities under that section and shall not be deemed to be incorporated by reference into any filing of
Zynga Inc. under the Securities Act of 1933, as amended, except as shall be expressly set forth by specific reference in such filing.
37
Period
Total
Number of
Shares
Purchased
Average
Price Paid
per Share
Total Amount
$ of Shares
Purchased as
Part of
Publicly-
Announced
Plans or
Programs
Maximum
$ Amount of
Share
May Yet Be
Purchased
Under the
Plans or
Programs
October 1
–
October 31, 2012
—
—
—
—
November 1
–
November 30, 2012
—
—
—
—
December 1
–
December 31, 2012
4,961,802
$
2.36
$
11,755,842
$
188,244,158
January 1
–
January 30, 2013
1,001,683
$
2.43
$
2,432,278
$
185,811,880
February 1
–
February 28, 2013
—
—
—
—
March 1
–
March 31, 2013
—
—
—
—
April 1
–
April 30, 2013
—
—
—
—
May 1
–
May 31, 2013
—
—
—
—
June 1
–
June 30, 2013
—
—
—
—
July 1
–
July 31, 2013
110,000
$
3.00
$
330,209
$
185,481,671
August 1
–
August 30, 2013
1,925,389
$
2.88
$
5,550,322
$
179,931,216
September 1
–
September 30, 2013
335,578
$
2.95
$
989,690
$
178,941,525
October 1
–
October 31, 2013
—
—
—
—
November 1
–
November 30, 2013
—
—
—
—
December 1
–
December 31, 2013
—
—
—
—
Total
8,334,452
$
2.53
$
21,058,342
$
178,941,658