Zynga 2013 Annual Report Download - page 74
Download and view the complete annual report
Please find page 74 of the 2013 Zynga annual report below. You can navigate through the pages in the report by either clicking on the pages listed below, or by using the keyword search tool below to find specific information within the annual report.-
 1
1 -
2
-
3
-
4
-
5
-
6
-
7
-
8
-
9
-
10
-
11
-
12
-
13
-
14
-
15
-
16
-
17
-
18
-
19
-
20
-
21
-
22
-
23
-
24
-
25
-
26
-
27
-
28
-
29
-
30
-
31
-
32
-
33
-
34
-
35
-
36
-
37
-
38
-
39
-
40
-
41
-
42
-
43
-
44
-
45
-
46
-
47
-
48
-
49
-
50
-
51
-
52
-
53
-
54
-
55
-
56
-
57
-
58
-
59
-
60
-
61
-
62
-
63
-
 64
64 -
 65
65 -
 66
66 -
 67
67 -
 68
68 -
 69
69 -
 70
70 -
 71
71 -
 72
72 -
 73
73 -
 74
74 -
 75
75 -
 76
76 -
 77
77 -
 78
78 -
 79
79 -
 80
80 -
 81
81 -
 82
82 -
 83
83 -
 84
84 -
85
-
86
-
87
-
88
-
89
-
90
-
91
-
92
-
93
-
94
-
95
-
96
-
97
-
98
-
99
-
100
-
101
-
102
-
103
-
104
-
105
-
106
-
107
-
108
-
109
-
110
-
111
-
112
-
113
-
114
-
115
-
116
-
117
-
118
-
119
-
120
-
121
-
122
-
123
-
124
-
125
-
126
-
127
-
128
-
129
 |
 |

Table of Contents
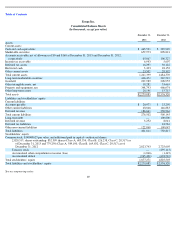
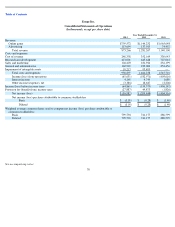
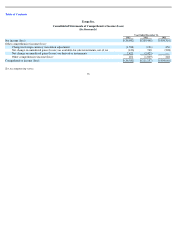
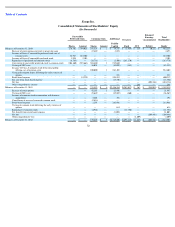
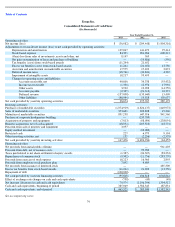
Zynga Inc.
Consolidated Statements of Operations
(In thousands, except per share data)
See accompanying notes.
70
Year Ended December 31,
2013
2012
2011
Revenue:
Online game
$
759,572
$
1,144,252
$
1,065,648
Advertising
113,694
137,015
74,452
Total revenue
873,266
1,281,267
1,140,100
Costs and expenses:
Cost of revenue
248,358
352,169
330,043
Research and development
413,001
645,648
727,018
Sales and marketing
104,403
181,924
234,199
General and administrative
162,918
189,004
254,456
Impairment of intangible assets
10,217
95,493
—
Total costs and expenses
938,897
1,464,238
1,545,716
Income (loss) from operations
(65,631
)
(182,971
)
(405,616
)
Interest income
4,148
4,749
1,680
Other income (expense), net
(3,386
)
18,647
(2,206
)
Income (loss) before income taxes
(64,869
)
(159,575
)
(406,142
)
Provision for (benefit from) income taxes
(27,887
)
49,873
(1,826
)
Net income (loss)
$
(36,982
)
$
(209,448
)
$
(404,316
)
Net income (loss) per share attributable to common stockholders
Basic
$
(0.05
)
$
(0.28
)
$
(1.40
)
Diluted
$
(0.05
)
$
(0.28
)
$
(1.40
)
Weighted average common shares used to compute net income (loss) per share attributable to
common stockholders:
Basic
799,794
741,177
288,599
Diluted
799,794
741,177
288,599