Zynga 2013 Annual Report Download - page 101
Download and view the complete annual report
Please find page 101 of the 2013 Zynga annual report below. You can navigate through the pages in the report by either clicking on the pages listed below, or by using the keyword search tool below to find specific information within the annual report.-
 1
1 -
2
-
3
-
4
-
5
-
6
-
7
-
8
-
9
-
10
-
11
-
12
-
13
-
14
-
15
-
16
-
17
-
18
-
19
-
20
-
21
-
22
-
23
-
24
-
25
-
26
-
27
-
28
-
29
-
30
-
31
-
32
-
33
-
34
-
35
-
36
-
37
-
38
-
39
-
40
-
41
-
42
-
43
-
44
-
45
-
46
-
47
-
48
-
49
-
50
-
51
-
52
-
53
-
54
-
55
-
56
-
57
-
58
-
59
-
60
-
61
-
62
-
63
-
64
-
65
-
66
-
67
-
68
-
69
-
70
-
71
-
72
-
73
-
74
-
75
-
76
-
77
-
78
-
79
-
80
-
81
-
82
-
83
-
84
-
85
-
86
-
87
-
88
-
89
-
90
-
 91
91 -
 92
92 -
 93
93 -
 94
94 -
 95
95 -
 96
96 -
 97
97 -
 98
98 -
 99
99 -
 100
100 -
 101
101 -
 102
102 -
 103
103 -
 104
104 -
 105
105 -
 106
106 -
 107
107 -
 108
108 -
 109
109 -
 110
110 -
 111
111 -
112
-
113
-
114
-
115
-
116
-
117
-
118
-
119
-
120
-
121
-
122
-
123
-
124
-
125
-
126
-
127
-
128
-
129
 |
 |
Table of Contents
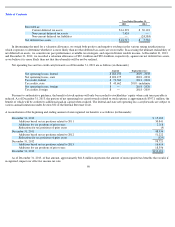
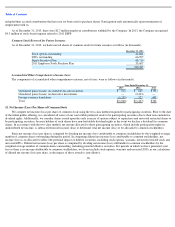
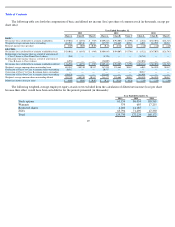
The following table sets forth the computation of basic and diluted net income (loss) per share of common stock (in thousands, except per
share data):
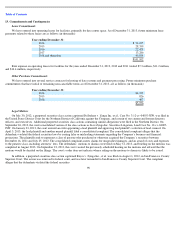
The following weighted-average employee equity awards were excluded from the calculation of diluted net income (loss) per share
because their effect would have been anti-dilutive for the periods presented (in thousands):
97
Year Ended December 31,
2013
2012
2011
Class A
Class B
Class C
Class A
Class B
Class C
Class A
Class B
Class C
BASIC:
Net income (loss) attributable to common stockholders
$
(29,082
)
$
(6,951
)
$
(949
)
$
(109,643
)
$
(94,007
)
$
(5,798
)
$
(8,522
)
$
(367,051
)
$
(28,743
)
Weighted
-
average common shares outstanding
628,947
150,330
20,517
387,995
332,665
20,517
6,083
261,999
20,517
Basic net income (loss) per share
$
(0.05
)
$
(0.05
)
$
(0.05
)
$
(0.28
)
$
(0.28
)
$
(0.28
)
$
(1.40
)
$
(1.40
)
$
(1.40
)
DILUTED:
Net income (loss) attributable to common stockholders
-
basic
$
(29,082
)
$
(6,951
)
$
(949
)
$
(109,643
)
$
(94,007
)
$
(5,798
)
$
(8,522
)
$
(367,051
)
$
(28,743
)
Reallocation of net income (loss) as a result of conversion of
Class C shares to Class B and Class A shares
(949
)
—
—
(
5,798
)
—
—
(
28,743
)
—
—
Reallocation of net income (loss) as a result of conversion of
Class B shares to Class A shares
(6,951
)
—
—
(
94,007
)
—
—
(
367,051
)
—
—
Net income (loss) attributable to common stockholders
-
diluted
$
(36,982
)
$
(6,951
)
$
(949
)
$
(209,448
)
$
(94,007
)
$
(5,798
)
$
(404,316
)
$
(367,051
)
$
(28,743
)
Weighted
-
average common shares outstanding
-
basic
628,947
150,330
20,517
387,995
332,665
20,517
6,083
261,999
20,517
Conversion of Class C to Class A common shares outstanding
20,517
—
—
20,517
—
—
—
—
—
Conversion of Class C to Class B common shares outstanding
—
—
—
—
—
—
20,517
—
—
Conversion of Class B to Class A common shares outstanding
150,330
—
—
332,665
—
—
261,999
—
—
Weighted
-
average common shares outstanding
-
diluted
799,794
150,330
20,517
741,177
332,665
20,517
288,599
261,999
20,517
Diluted net income (loss) per share
$
(0.05
)
$
(0.05
)
$
(0.05
)
$
(0.28
)
$
(0.28
)
$
(0.28
)
$
(1.40
)
$
(1.40
)
$
(1.40
)
Year Ended December 31,
2013
2012
2011
Stock options
61,154
86,054
103,565
Warrants
579
695
17,215
Restricted shares
4,203
14,185
—
ZSUs
63,794
71,290
47,392
Total
129,730
172,224
168,172