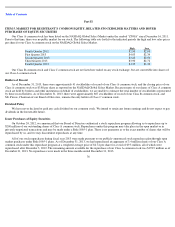
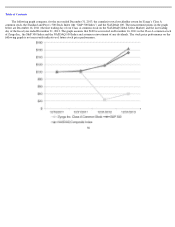
Zynga 2013 Annual Report Download - page 50
Download and view the complete annual report
Please find page 50 of the 2013 Zynga annual report below. You can navigate through the pages in the report by either clicking on the pages listed below, or by using the keyword search tool below to find specific information within the annual report.-
 1
1 -
2
-
3
-
4
-
5
-
6
-
7
-
8
-
9
-
10
-
11
-
12
-
13
-
14
-
15
-
16
-
17
-
18
-
19
-
20
-
21
-
22
-
23
-
24
-
25
-
26
-
27
-
28
-
29
-
30
-
31
-
32
-
33
-
34
-
35
-
36
-
37
-
38
-
39
-
 40
40 -
 41
41 -
 42
42 -
 43
43 -
 44
44 -
 45
45 -
 46
46 -
 47
47 -
 48
48 -
 49
49 -
 50
50 -
 51
51 -
 52
52 -
 53
53 -
 54
54 -
 55
55 -
 56
56 -
 57
57 -
 58
58 -
 59
59 -
 60
60 -
61
-
62
-
63
-
64
-
65
-
66
-
67
-
68
-
69
-
70
-
71
-
72
-
73
-
74
-
75
-
76
-
77
-
78
-
79
-
80
-
81
-
82
-
83
-
84
-
85
-
86
-
87
-
88
-
89
-
90
-
91
-
92
-
93
-
94
-
95
-
96
-
97
-
98
-
99
-
100
-
101
-
102
-
103
-
104
-
105
-
106
-
107
-
108
-
109
-
110
-
111
-
112
-
113
-
114
-
115
-
116
-
117
-
118
-
119
-
120
-
121
-
122
-
123
-
124
-
125
-
126
-
127
-
128
-
129
 |
 |

Table of Contents
ABPU. We define ABPU as (i) our total bookings in a given period, divided by (ii) the number of days in that period, divided by, (iii) the
average DAUs during the period. We believe that ABPU provides useful information to investors and others in understanding and evaluating our
results in the same manner as our management and board of directors. We use ABPU as a measure of overall monetization across all of our
players through the sale of virtual goods and advertising.
Our business model for social games is designed so that, as there are more players that play our games, social interactions increase and the
more valuable the games and our business become. All engaged players of our games help drive our bookings and, consequently, both online
game revenue and advertising revenue. Virtual goods are purchased by players who are socializing with, competing against or collaborating with
other players, most of whom do not buy virtual goods. Accordingly, we primarily focus on bookings, DAUs, MAUs, MUUs, MUPs and ABPU,
which together we believe best reflect key audience metrics.
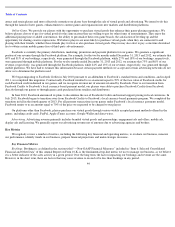
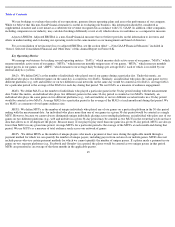
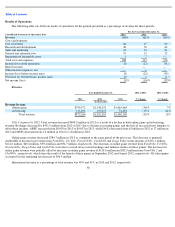
The table below shows average DAUs, MAUs, MUUs, MUPs and ABPU for the last eight quarters:
Average DAUs, MAUs and MUUs declined in each consecutive quarter in 2013, and declined when comparing the three months ended
December 31, 2013 to December 31, 2012. We have seen declines in users for our existing games, and our new game launches during 2013 did
not grow sufficiently to offset the declines in users for our existing games. In addition, MUPs declined in the three months ended December 31,
2013 compared to the three months ended December 31, 2012, as payers in Zynga Poker, FarmVille 2 and ChefVille contributed more MUPs in
2012 than in 2013. ABPU increased in each of the last three quarters of 2013 compared to the prior quarter due to a faster decline in DAUs in
those periods than the decline in bookings. Future growth in audience and engagement will depend on our ability to retain current players, attract
new players, launch new games and expand into new market and distribution platforms.
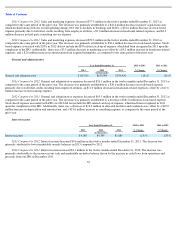
Other Metrics
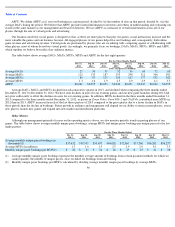
Although our management primarily focuses on the operating metrics above, we also monitor periodic trends in paying players of our
games. The table below shows average monthly unique payer bookings, average MUPs and unique payer bookings per unique payer for the last
eight quarters:
46
For the Three Months Ended
Dec 31,
2013
Sep 30,
2013
Jun 30,
2013
Mar 31,
2013
Dec 31,
2012
Sep 30,
2012
Jun 30,
2012
Mar 31,
2012
(users and payers in millions)
Average DAUs
27
30
39
52
56
60
72
65
Average MAUs
112
133
187
253
298
311
306
292
Average MUUs
80
97
123
150
167
177
192
182
Average MUPs
1.3
1.6
1.9
2.5
2.9
2.9
4.1
3.5
ABPU
$
0.060
$
0.055
$
0.053
$
0.049
$
0.051
$
0.047
$
0.046
$
0.055
For the Three Months Ended
Dec 31,
2013
Sep 30,
2013
Jun 30,
2013
Mar 31,
2013
Dec 31,
2012
Sep 30,
2012
Jun 30,
2012
Mar 31,
2012
Average monthly unique payer bookings (in
thousands)(1)
$
37,432
$
39,535
$
50,657
$
64,028
$
72,867
$
71,760
$
86,282
$
96,277
Average MUPs (in millions)
1.3
1.6
1.9
2.5
2.9
2.9
4.1
3.5
Monthly unique payer bookings per MUP(2)
$
28
$
25
$
26
$
26
$
25
$
25
$
21
$
28
(1) Average monthly unique payer bookings represent the monthly average amount of bookings from certain payment methods for which we
cannot quantify the number of unique payers. Also excluded are bookings from advertising.
(2)
Monthly unique payer bookings per MUP is calculated by dividing average monthly unique payer bookings by average MUPs.