Zynga 2013 Annual Report Download - page 59
Download and view the complete annual report
Please find page 59 of the 2013 Zynga annual report below. You can navigate through the pages in the report by either clicking on the pages listed below, or by using the keyword search tool below to find specific information within the annual report.-
 1
1 -
2
-
3
-
4
-
5
-
6
-
7
-
8
-
9
-
10
-
11
-
12
-
13
-
14
-
15
-
16
-
17
-
18
-
19
-
20
-
21
-
22
-
23
-
24
-
25
-
26
-
27
-
28
-
29
-
30
-
31
-
32
-
33
-
34
-
35
-
36
-
37
-
38
-
39
-
40
-
41
-
42
-
43
-
44
-
45
-
46
-
47
-
48
-
 49
49 -
 50
50 -
 51
51 -
 52
52 -
 53
53 -
 54
54 -
 55
55 -
 56
56 -
 57
57 -
 58
58 -
 59
59 -
 60
60 -
 61
61 -
 62
62 -
 63
63 -
 64
64 -
 65
65 -
 66
66 -
 67
67 -
 68
68 -
 69
69 -
70
-
71
-
72
-
73
-
74
-
75
-
76
-
77
-
78
-
79
-
80
-
81
-
82
-
83
-
84
-
85
-
86
-
87
-
88
-
89
-
90
-
91
-
92
-
93
-
94
-
95
-
96
-
97
-
98
-
99
-
100
-
101
-
102
-
103
-
104
-
105
-
106
-
107
-
108
-
109
-
110
-
111
-
112
-
113
-
114
-
115
-
116
-
117
-
118
-
119
-
120
-
121
-
122
-
123
-
124
-
125
-
126
-
127
-
128
-
129
 |
 |
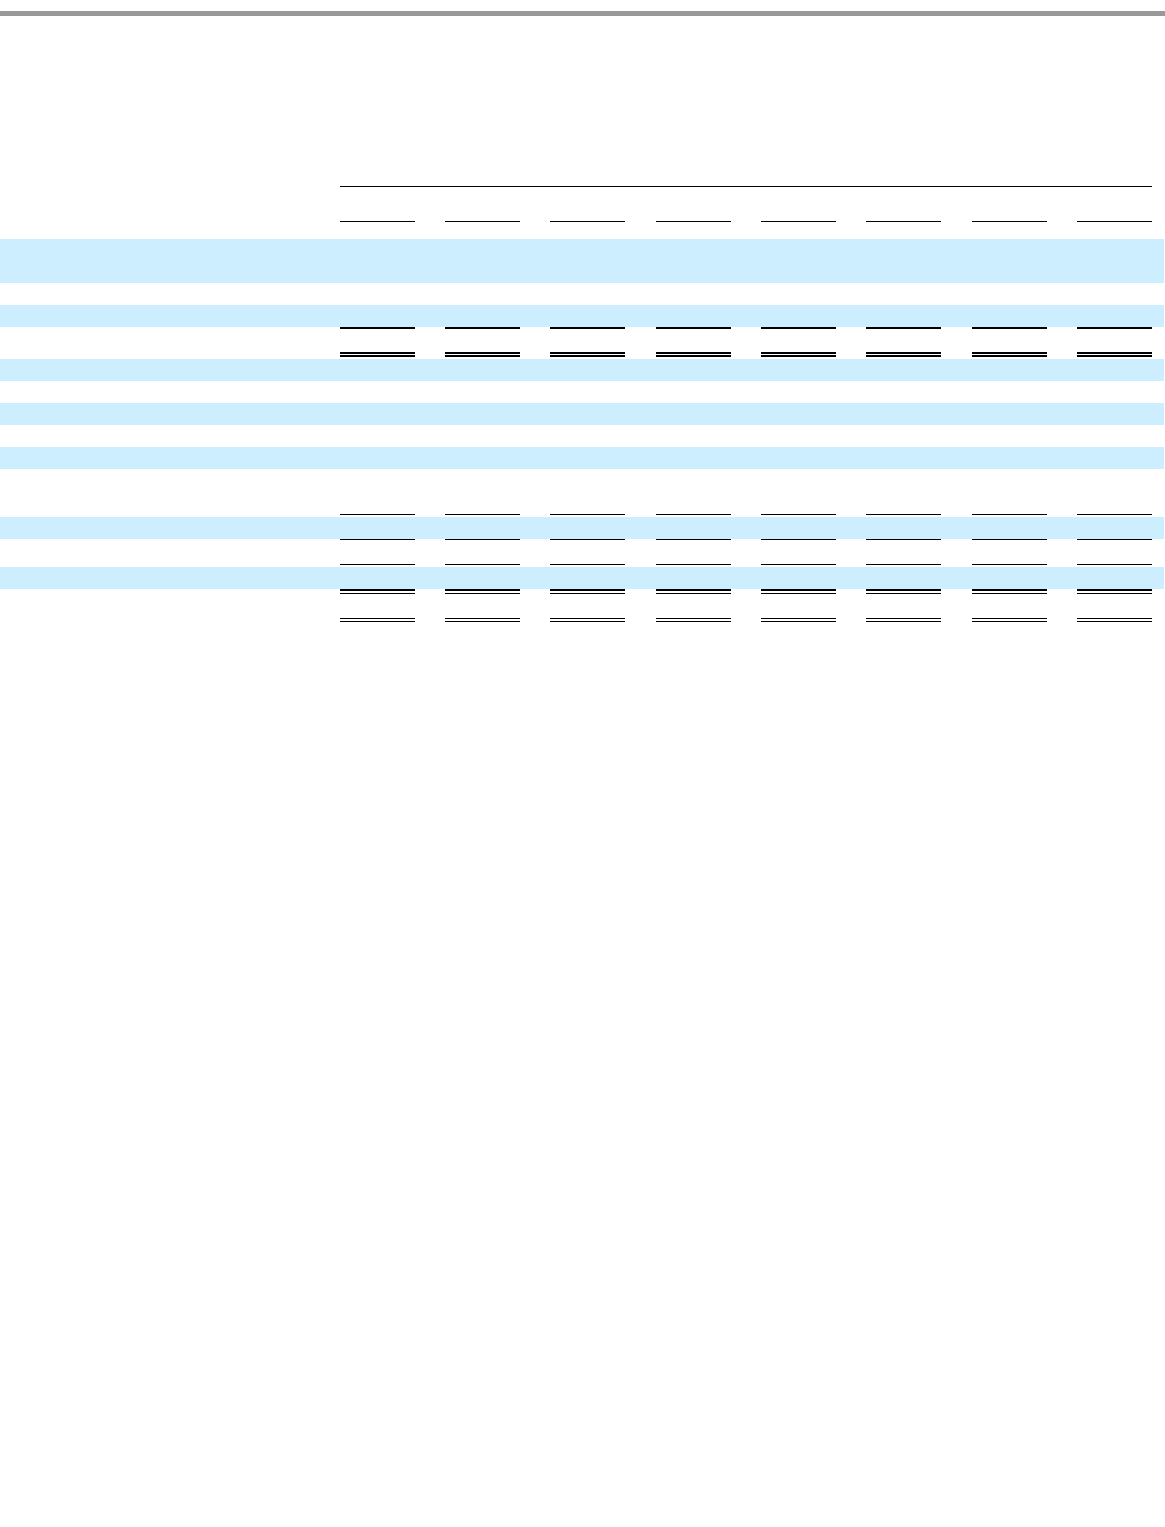
Table of Contents
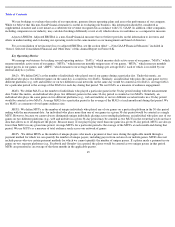
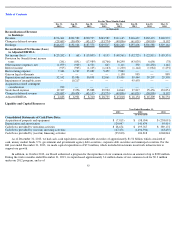
financial statements and related notes included elsewhere in this Annual Report on Form 10-K. The results of historical periods are not
necessarily indicative of the results of operations for a full year or any future period.
55
For the Three Months Ended
Dec 31,
2013
Sep 30,
2013
Jun 30,
2013
Mar 31,
2013
Dec 31,
2012
Sep 30,
2012
Jun 30,
2012
Mar 31,
2012
(in thousands, except per share data)
Consolidated Statements of
Operations Data:
Online game
$
152,310
$
174,370
$
203,326
$
229,566
$
274,337
$
285,587
$
291,548
$
292,780
Advertising
24,052
28,210
27,409
34,023
36,828
31,050
40,945
28,192
Total Revenue
176,362
202,580
230,735
263,589
311,165
316,637
332,493
320,972
Costs and expenses:
Cost of revenue
58,876
59,011
61,077
69,394
77,056
90,150
94,841
90,122
Research and development
78,475
81,023
124,322
129,181
131,847
155,609
171,316
186,876
Sales and marketing
24,763
21,170
31,163
27,307
32,446
36,586
56,055
56,837
General and administrative
41,725
34,012
44,541
42,640
32,206
35,353
48,730
72,715
Impairment of intangible
assets
—
10,217
—
—
—
95,493
—
—
Total costs and expenses
203,839
205,433
261,103
268,522
273,555
413,191
370,942
406,550
Income (loss) from operations
(27,477
)
(2,853
)
(30,368
)
(4,933
)
37,610
(96,554
)
(38,449
)
(85,578
)
Net income (loss)
$
(25,242
)
$
(68
)
$
(15,805
)
$
4,133
$
(48,561
)
$
(52,725
)
$
(22,811
)
$
(85,351
)
Earnings per share
—
basic and diluted
$
(0.03
)
$
0.00
$
(0.02
)
$
0.01
$
(0.06
)
$
(0.07
)
$
(0.03
)
$
(0.12
)