Zynga 2013 Annual Report Download - page 54
Download and view the complete annual report
Please find page 54 of the 2013 Zynga annual report below. You can navigate through the pages in the report by either clicking on the pages listed below, or by using the keyword search tool below to find specific information within the annual report.-
 1
1 -
2
-
3
-
4
-
5
-
6
-
7
-
8
-
9
-
10
-
11
-
12
-
13
-
14
-
15
-
16
-
17
-
18
-
19
-
20
-
21
-
22
-
23
-
24
-
25
-
26
-
27
-
28
-
29
-
30
-
31
-
32
-
33
-
34
-
35
-
36
-
37
-
38
-
39
-
40
-
41
-
42
-
43
-
 44
44 -
 45
45 -
 46
46 -
 47
47 -
 48
48 -
 49
49 -
 50
50 -
 51
51 -
 52
52 -
 53
53 -
 54
54 -
 55
55 -
 56
56 -
 57
57 -
 58
58 -
 59
59 -
 60
60 -
 61
61 -
 62
62 -
 63
63 -
 64
64 -
65
-
66
-
67
-
68
-
69
-
70
-
71
-
72
-
73
-
74
-
75
-
76
-
77
-
78
-
79
-
80
-
81
-
82
-
83
-
84
-
85
-
86
-
87
-
88
-
89
-
90
-
91
-
92
-
93
-
94
-
95
-
96
-
97
-
98
-
99
-
100
-
101
-
102
-
103
-
104
-
105
-
106
-
107
-
108
-
109
-
110
-
111
-
112
-
113
-
114
-
115
-
116
-
117
-
118
-
119
-
120
-
121
-
122
-
123
-
124
-
125
-
126
-
127
-
128
-
129
 |
 |

Table of Contents
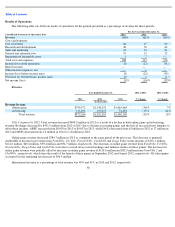
Results of Operations
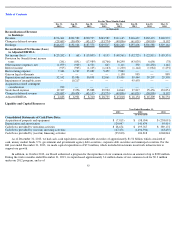
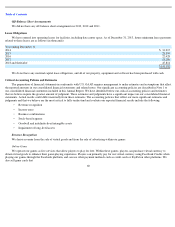
The following table sets forth our results of operations for the periods presented as a percentage of revenue for those periods:
Revenue
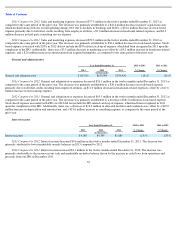
2013 Compared to 2012. Total revenue decreased $408.0 million in 2013 as a result of a decline in both online game and advertising
revenue. Bookings decreased by $431.5 million from 2012 to 2013 due to declines in existing games and the lack of successful new launches to
offset these declines. ABPU increased from $0.050 in 2012 to $0.053 in 2013, while DAUs decreased from 63 million in 2012 to 37 million in
2013 and MUPs decreased from 3.4 million in 2012 to 1.8 million in 2013.
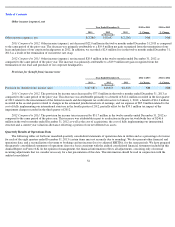
Online game revenue decreased $384.7 million in 2013 as compared to the same period of the prior year. This decrease is primarily
attributable to decreases in revenue from FarmVille, CityVille, FrontierVille, CastleVille and Zynga Poker in the amounts of $152.1 million,
$112.6 million, $60.4 million, $59.4 million and $54.7 million, respectively. The decreases in online game revenue from FarmVille, CityVille,
FrontierVille, Zynga Poker
and CastleVille were due to overall decay rate in bookings and audience metrics in these games. The decreases in
online game revenue were partially offset by increases in online game revenue of $118.0 million and $32.9 million from FarmVille 2 and
ChefVille , respectively, which were the result of the launch of these games in September 2012 and August 2012, respectively. All other games
accounted for the remaining net decrease of $96.4 million.
International revenue as a percentage of total revenue was 40% and 41% in 2013 and 2012, respectively.
50
For the Year Ended December 31,
Consolidated Statements of Operations Data
:
2013
2012
2011
Revenue
100
%
100
%
100
%
Costs and expenses:
Cost of revenue
28
27
29
Research and development
48
50
64
Sales and marketing
12
14
21
General and administrative
19
15
22
Impairment of intangible assets
1
7
—
Total costs and expenses
108
113
136
Income (loss) from operations
(8
)
(13
)
(36
)
Interest income
—
—
—
Other income (expense), net
—
1
—
Income (loss) before income taxes
(8
)
(12
)
(36
)
Provision for (benefit from) income taxes
(3
)
4
(1
)
Net income (loss)
(5
)%
(16
)%
(35
)%
Year Ended December 31,
2012 to 2013
% Change
2011 to 2012
% Change
2013
2012
2011
(in thousands)
Revenue by type:
Online game
$
759,572
$
1,144,252
$
1,065,648
(34
)%
7
%
Advertising
113,694
137,015
74,452
(17
)%
84
%
Total revenue
$
873,266
$
1,281,267
$
1,140,100
(32
)%
12
%