Western Union 2008 Annual Report Download - page 82
Download and view the complete annual report
Please find page 82 of the 2008 Western Union annual report below. You can navigate through the pages in the report by either clicking on the pages listed below, or by using the keyword search tool below to find specific information within the annual report.-
 1
1 -
2
-
3
-
4
-
5
-
6
-
7
-
8
-
9
-
10
-
11
-
12
-
13
-
14
-
15
-
16
-
17
-
18
-
19
-
20
-
21
-
22
-
23
-
24
-
25
-
26
-
27
-
28
-
29
-
30
-
31
-
32
-
33
-
34
-
35
-
36
-
37
-
38
-
39
-
40
-
41
-
42
-
43
-
44
-
45
-
46
-
47
-
48
-
49
-
50
-
51
-
52
-
53
-
54
-
55
-
56
-
57
-
58
-
59
-
60
-
61
-
62
-
63
-
64
-
65
-
66
-
67
-
68
-
69
-
70
-
71
-
 72
72 -
 73
73 -
 74
74 -
 75
75 -
 76
76 -
 77
77 -
 78
78 -
 79
79 -
 80
80 -
 81
81 -
 82
82 -
 83
83 -
 84
84
 |
 |

WESTERN UNION
2008 Annual Report
8080
The geographic split of revenue above has been deter-
mined based upon the country where a money transfer is
initiated and the country where a money transfer is paid
with revenue being split 50% between the two countries.
Long-lived assets, consisting of “Property and equipment,
net,” are presented based upon the location of the assets.
A majority of Western Union’s consumer-to-consumer
transactions involve at least one non-United States location.
Based on the method used to attribute revenue between
countries described in the paragraph above, no individual
country outside the United States accounted for more than
10% of segment revenue for the years ended December 31,
2008, 2007 and 2006. In addition, no individual agent or
biller accounted for greater than 10% of consumer-to-
consumer or consumer-to-business segment revenue,
respectively, during these periods.
18. Subsequent Event
In February 2009, the Company entered into an agreement
to acquire the money transfer business of European-based
FEXCO, one of the Company’s largest agents providing
services in the United Kingdom, Spain, Ireland and other
European countries. Prior to the acquisition, the Company
holds a 24.65% interest in FEXCO Group Holdings (FEXCO
Group), which is a holding company for both the money
transfer business as well as various unrelated businesses.
The Company will surrender its 24.65% interest in FEXCO
Group and pay €123.1 million (approximately $160 mil-
lion based on currency exchange rates at deal signing)
as consideration for the overall money transfer business.
The acquisition is expected to close in the first half of
2009, subject to regulatory approvals and satisfaction
of closing conditions. The acquisition will be recognized
at 100% of the fair value of the money transfer business,
which will exceed the cash consideration of €123.1 million
given the non-cash consideration conveyed via the sale of
our interest in FEXCO Group. The fair value of the money
transfer business will be determined upon closing and is
subject to fluctuation due to changes in exchange rates
and other valuation inputs.
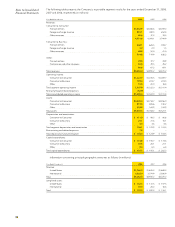
19. Quarterly Financial Information (Unaudited)
Summarized quarterly results for the years ended December 31, 2008 and 2007 are as follows (in millions):
Year Ended
December 31,
2008 by Quarter: Q1 Q2 Q3 Q4 2008
Revenues $1,265.9 $1,347.1 $1,377.4 $1,291.6 $5,282.0
Expenses
(a) 956.6 1,010.9 1,002.2 957.3 3,927.0
Other expense, net 16.8 28.2 42.2 29.1 116.3
Income before income taxes 292.5 308.0 333.0 305.2 1,238.7
Provision for income taxes 85.4 76.5 92.2 65.6 319.7
Net income $ 207.1 $ 231.5 $ 240.8 $ 239.6 $ 919.0
Earnings per share:
Basic $ 0.28 $ 0.31 $ 0.33 $ 0.34 $ 1.26
Diluted $ 0.27 $ 0.31 $ 0.33 $ 0.34 $ 1.24
Weighted-average shares outstanding:
Basic 746.7 736.5 724.9 712.5 730.1
Diluted 756.8 747.5 737.2 713.8 738.2
(a) Includes $24.2 million in the first quarter, $22.9 million in the second quarter, $3.2 million in the third quarter and $32.6 million in the fourth quarter of restructuring
and related expenses. For more information, see Note 3, “Restructuring and Related Expenses.”
Year Ended
December 31,
2007 by Quarter: Q1 Q2 Q3 Q4 2007
Revenues $1,131.0 $1,202.9 $1,257.2 $1,309.1 $4,900.2
Expenses
(b) 826.4 880.2 927.1 944.5 3,578.2
Other expense, net 22.5 24.5 23.2 29.4 99.6
Income before income taxes 282.1 298.2 306.9 335.2 1,222.4
Provision for income taxes 88.9 93.7 90.6 91.9 365.1
Net income $ 193.2 $ 204.5 $ 216.3 $ 243.3 $ 857.3
Earnings per share:
Basic $ 0.25 $ 0.27 $ 0.29 $ 0.32 $ 1.13
Diluted $ 0.25 $ 0.26 $ 0.28 $ 0.32 $ 1.11
Weighted-average shares outstanding:
Basic 768.2 764.8 757.5 749.5 760.2
Diluted 783.3 779.0 767.4 761.7 772.9
(b) Includes a non-cash pretax stock compensation accelerated vesting charge of $22.3 million during the third quarter of 2007. For more information, see Note 16.