Western Union 2008 Annual Report Download - page 69
Download and view the complete annual report
Please find page 69 of the 2008 Western Union annual report below. You can navigate through the pages in the report by either clicking on the pages listed below, or by using the keyword search tool below to find specific information within the annual report.-
 1
1 -
2
-
3
-
4
-
5
-
6
-
7
-
8
-
9
-
10
-
11
-
12
-
13
-
14
-
15
-
16
-
17
-
18
-
19
-
20
-
21
-
22
-
23
-
24
-
25
-
26
-
27
-
28
-
29
-
30
-
31
-
32
-
33
-
34
-
35
-
36
-
37
-
38
-
39
-
40
-
41
-
42
-
43
-
44
-
45
-
46
-
47
-
48
-
49
-
50
-
51
-
52
-
53
-
54
-
55
-
56
-
57
-
58
-
 59
59 -
 60
60 -
 61
61 -
 62
62 -
 63
63 -
 64
64 -
 65
65 -
 66
66 -
 67
67 -
 68
68 -
 69
69 -
 70
70 -
 71
71 -
 72
72 -
 73
73 -
 74
74 -
 75
75 -
 76
76 -
 77
77 -
 78
78 -
 79
79 -
80
-
81
-
82
-
83
-
84
 |
 |
6767
Notes to Consolidated
Financial Statements
Differences in expected returns on plan assets estimated
at the beginning of the year versus actual returns, and
assumptions used to estimate the beginning of year pro-
jected benefit obligation versus the end of year obliga-
tion (principally discount rate and mortality assumptions)
are, on a combined basis, considered actuarial gains and
losses. Such actuarial gains and losses are recognized as
a component of “Comprehensive income” and amortized
to income over the average remaining life expectancy of
the plan participants. Included in “Accumulated other
comprehensive loss” at December 31, 2008 is $3.6 mil-
lion ($2.3 million, net of tax) of actuarial losses that are
expected to be recognized in net periodic pension cost
during the year ended December 31, 2009.
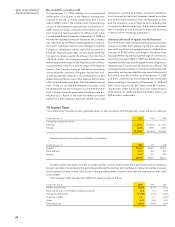
The following table provides the amounts recognized in the Consolidated Balance Sheets (in millions):
December 31, 2008 2007
Accrued benefit liability $(107.1) $(27.6)
Accumulated other comprehensive loss 150.3 73.1
Net amount recognized $ 43.2 $ 45.5
The following table provides the components of net periodic benefit cost/(income) for the plans (in millions):
December 31, 2008 2007 2006
Interest cost $ 24.4 $ 24.6 $ 24.8
Expected return on plan assets (27.5) (28.4) (29.9)
Amortization of actuarial loss 2.7 3.6 4.2
Employee termination costs 2.8 — —
Net periodic benefit cost/(income) $ 2.4 $ (0.2) $ (0.9)
During 2008, the Company recorded $2.8 million of expense relating to the termination of certain retirement eligible
union and management plan participants in connection with the restructuring and related activities disclosed in Note 3.
The pension liability included in other accumulated comprehensive loss, net of tax, increased/(decreased)
$46.4 million, ($15.3) million and ($10.8) million in 2008, 2007 and 2006, respectively. The significant comprehensive
loss in 2008 was caused by a decline in the fair value of plan assets, which was primarily attributable to a decrease in
the value of the equity securities within the plan asset portfolio.
The weighted-average rate assumptions used in the measurement of the Company’s benefit obligation are as
follows:
2008 2007
Discount rate 6.26% 6.02%
The weighted-average rate assumptions used in the measurement of the Company’s net cost (income) are as
follows:
2008 2007 2006
Discount rate 6.02% 5.62% 5.24%
Expected long-term return on plan assets 7.50% 7.50% 7.50%
SFAS No. 87 requires the sponsor of a defined benefit plan
to measure the plan’s obligations and annual expense using
assumptions that reflect best estimates and are consistent
to the extent that each assumption reflects expectations
of future economic conditions. As the bulk of the pension
benefits will not be paid for many years, the computation
of pension expenses and benefits is based on assump-
tions about future interest rates and expected rates of
return on plan assets. In general, pension obligations are
most sensitive to the discount rate assumption, and it is
set based on the rate at which the pension benefits could
be settled effectively. The discount rate is determined by
matching the timing and amount of anticipated payouts
under the plans to the rates from a AA spot rate yield curve.
The curve is derived from AA bonds of varying maturities.
Western Union employs a building block approach in
determining the long-term rate of return for plan assets.
Historical markets are studied and long-term historical
relationships between equities and fixed-income securities
are preserved consistent with the widely accepted capital
market principle that assets with higher volatility generate
a greater return over the long run. Current market factors
such as inflation and interest rates are evaluated before
long-term capital market assumptions are determined. The
long-term portfolio return is established using a building
block approach with proper consideration of diversifica-
tion and re-balancing. Peer data and historical returns are
reviewed to check for reasonableness and appropriateness.