Western Union 2008 Annual Report Download - page 22
Download and view the complete annual report
Please find page 22 of the 2008 Western Union annual report below. You can navigate through the pages in the report by either clicking on the pages listed below, or by using the keyword search tool below to find specific information within the annual report.-
 1
1 -
2
-
3
-
4
-
5
-
6
-
7
-
8
-
9
-
10
-
11
-
 12
12 -
 13
13 -
 14
14 -
 15
15 -
 16
16 -
 17
17 -
 18
18 -
 19
19 -
 20
20 -
 21
21 -
 22
22 -
 23
23 -
 24
24 -
 25
25 -
 26
26 -
 27
27 -
 28
28 -
 29
29 -
 30
30 -
 31
31 -
 32
32 -
33
-
34
-
35
-
36
-
37
-
38
-
39
-
40
-
41
-
42
-
43
-
44
-
45
-
46
-
47
-
48
-
49
-
50
-
51
-
52
-
53
-
54
-
55
-
56
-
57
-
58
-
59
-
60
-
61
-
62
-
63
-
64
-
65
-
66
-
67
-
68
-
69
-
70
-
71
-
72
-
73
-
74
-
75
-
76
-
77
-
78
-
79
-
80
-
81
-
82
-
83
-
84
 |
 |

WESTERN UNION
2008 Annual Report
20
Revenues overview
The following provides highlights of revenue growth while
a more detailed discussion is included in “—Segment
Discussion.”
The majority of transaction fees and foreign exchange
revenue are contributed by our consumer-to-consumer
segment, which is discussed in greater detail in “Segment
Discussion.” Consolidated revenue growth of 8% and 10%
during the years ended December 31, 2008 and 2007,
respectively, was primarily driven by revenue growth
internationally, particularly in the Europe, Middle East,
Africa and South Asia (“EMEASA”) region, due to increased
money transfers at existing agent locations, and to a lesser
extent, money transfers at new agent locations and due to
the impact of translating foreign currency denominated
revenues into the United States dollar, specifically the euro,
discussed below. Our international consumer-to-consumer
transactions that were originated outside of the United
States also continued to experience strong revenue and
transaction growth for the years ended December 31,
2008 and 2007 compared to the corresponding periods
in the prior year. We experienced strong growth in our
money transfer business to India, and in the Gulf States,
which offset slower growth in certain European markets
for the year ended 2008 compared to 2007.
However, during the fourth quarter of 2008, revenue
was impacted by the weakening global economy and its
effect on Western Union customers. In the fourth quarter,
transaction growth rates slowed sequentially compared
to the first nine months of 2008. In addition, the amount
of money remitted per transaction declined in the fourth
quarter of 2008 compared to the fourth quarter of 2007.
These factors resulted in less transaction fee and foreign
exchange revenue in the fourth quarter of 2008 compared
to the fourth quarter of 2007.
Fluctuations in the exchange rate between the United
States dollar and currencies other than the United States
dollar for the year ended December 31, 2008 have resulted
in a benefit to transaction fee and foreign exchange rev-
enue of $96 million, over the previous year, net of foreign
currency hedges, that would not have occurred had there
been constant currency rates. The positive impact to oper-
ating profit derived from foreign currency exchange rates
increasing against the United States dollar during the year
was offset by the impact of foreign currency derivative
losses for those foreign currency derivatives not designated
as hedges and the portion of fair value that is excluded
from the measure of effectiveness for these contracts des-
ignated as hedges thereby resulting in a minimal impact
20
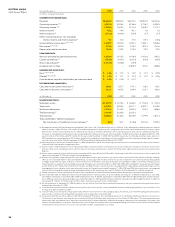
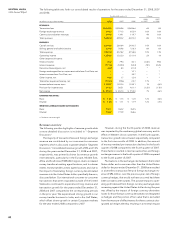
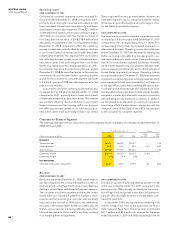
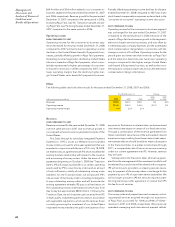
The following table sets forth our consolidated results of operations for the years ended December31, 2008, 2007
and 2006.
Years Ended December 31, % Change
2008 2007
(in millions, except per share amounts) 2008 2007 2006 vs.2007 vs.2006
REVENUES:
Transactionfees $4,240.8 $3,989.8 $3,696.6 6% 8%
Foreign exchange revenue 896.3 771.3 653.9 16% 18%
Commission and other revenues 144.9 139.1 119.7 4% 16%
Total revenues 5,282.0 4,900.2 4,470.2 8% 10%
EXPENSES:
Cost of services 3,093.0 2,808.4 2,430.5 10% 16%
Selling, general and administrative 834.0 769.8 728.3 8% 6%
Total expenses 3,927.0 3,578.2 3,158.8 10% 13%
Operating income 1,355.0 1,322.0 1,311.4 2% 1%
Other (expense)/income:
Interest income 45.2 79.4 40.1 (43)% 98%
Interest expense (171.2) (189.0) (53.4) (9)% 254%
Derivative (losses)/gains, net (6.9) 8.3 (21.2) * *
Foreign exchange effect on notes receivable from First Data, net — — 10.1 — *
Interest income from First Data, net — — 35.7 — *
Other income, net 16.6 1.7 12.4 * *
Total other (expense)/income, net (116.3) (99.6) 23.7 17% *
Income before income taxes 1,238.7 1,222.4 1,335.1 1% (8)%
Provision for income taxes 319.7 365.1 421.1 (12)% (13)%
Net income $ 919.0 $ 857.3 $ 914.0 7% (6)%
EARNINGS PER SHARE:
Basic $ 1.26 $ 1.13 $ 1.20 12% (6)%
Diluted $ 1.24 $ 1.11 $ 1.19 12% (7)%
WEIGHTED-AVERAGE SHARES OUTSTANDING:
Basic 730.1 760.2 764.5
Diluted 738.2 772.9 768.6
* Calculation not meaningful