Western Union 2008 Annual Report Download - page 30
Download and view the complete annual report
Please find page 30 of the 2008 Western Union annual report below. You can navigate through the pages in the report by either clicking on the pages listed below, or by using the keyword search tool below to find specific information within the annual report.-
 1
1 -
2
-
3
-
4
-
5
-
6
-
7
-
8
-
9
-
10
-
11
-
12
-
13
-
14
-
15
-
16
-
17
-
18
-
19
-
 20
20 -
 21
21 -
 22
22 -
 23
23 -
 24
24 -
 25
25 -
 26
26 -
 27
27 -
 28
28 -
 29
29 -
 30
30 -
 31
31 -
 32
32 -
 33
33 -
 34
34 -
 35
35 -
 36
36 -
 37
37 -
 38
38 -
 39
39 -
 40
40 -
41
-
42
-
43
-
44
-
45
-
46
-
47
-
48
-
49
-
50
-
51
-
52
-
53
-
54
-
55
-
56
-
57
-
58
-
59
-
60
-
61
-
62
-
63
-
64
-
65
-
66
-
67
-
68
-
69
-
70
-
71
-
72
-
73
-
74
-
75
-
76
-
77
-
78
-
79
-
80
-
81
-
82
-
83
-
84
 |
 |

WESTERN UNION
2008 Annual Report
28
Operating income
2008 COMPARED TO 2007
Consumer-to-consumer operating income increased for
the year ended December 31, 2008 compared to 2007,
primarily driven by higher revenue and related profits
from increased transactions internationally and lower
stock-based compensation expenses. Of the $22.3 million
accelerated stock-based compensation vesting charge in
2007 taken in connection with the change in control of
First Data, that did not recur in 2008, $18.9 million was
allocated to this segment in 2007. During the year ended
December 31, 2008 compared to 2007, the operating
income increase was partially offset by revenue declines
in our United States businesses, and higher employee
compensation expenses. The ongoing shift in our business
mix reflecting stronger growth in our international busi-
ness, which carries lower profit margins than in our United
States originated business, also impacted consumer-
to-consumer operating income during the year ended
December 31, 2008. As described earlier in the revenues
overview and due to the same factors, operating income
growth for the consumer-to-consumer segment was lower
in the fourth quarter of 2008 than that experienced in the
previous nine months.
Consumer-to-consumer operating income margin also
increased during the year ended December 31, 2008
compared to 2007, primarily due to lower stock-based
compensation expense, as described above. This increase
was partially offset by revenue declines in our United
States businesses and the ongoing shift in our business
mix reflecting stronger growth in our international busi-
ness, which carries lower profit margins than in our United
Revenues
2008 COMPARED TO 2007
During the year ended December 31, 2008, overall revenue
was flat compared to the corresponding period in 2007, as
revenue growth in the Pago Fácil business was offset by a
decline in United States cash-based bill payment revenue.
The consumer-to-business segment, including the United
States electronic-based bill payments business which
experienced flat revenues year over year, was adversely
impacted in the last half of 2008 due to the weakening
economy in the United States. Some consumers who are
likely to use our services are having difficulty paying their
bills and are unable to obtain credit in any form, resulting
in us handling fewer bill payments.
States originated business as noted earlier. However, we
have been experiencing a convergence between interna-
tional operating profits margins and profit margins of our
United States originated businesses.
2007 COMPARED TO 2006
The consumer-to-consumer segment’s operating income
increased by 1% for the year ended December 31, 2007
compared to the corresponding period in 2006. This
increase was primarily driven by increased revenue in our
international business. Operating income during the year
ended December 31, 2007 was impacted by the ongoing
shift in our business mix reflecting stronger growth in our
international business, which carries lower profit margins
than in our United States originated businesses. However,
we have been experiencing a convergence between inter-
national operating profit margins and profit margins of our
United States originated businesses. Operating income
during the year ended December 31, 2007 was adversely
impacted by incremental public company expenses which
are incremental to both costs allocated by First Data prior
to the spin-off and presumed overhead allocations from
First Data had we remained part of First Data. Such incre-
mental public company expenses include salaries, benefits,
equipment, supplies and other costs incurred in connection
with operating as a separate public company. In addition,
we recognized an accelerated non-cash stock compensa-
tion charge of $22.3 million taken in connection with the
change in control of First Data, of which 85% was allocated
to the consumer-to-consumer segment.
2007 COMPARED TO 2006
Transaction growth of 62% and revenue growth of 13%
in the year ended December 31, 2007 compared to the
same period in 2006 primarily resulted from the acquisi-
tion of Pago Fácil and growth in electronic bill payments,
partially offset by slight declines in United States cash-
based bill payments.
In December 2006, we acquired the remaining 75%
interest in Pago Fácil. Prior to the acquisition, we held a
25% interest in Pago Fácil. This acquisition contributed
$67.7 million and $3.6 million in revenue for the years
ended December 31, 2007 and 2006, respectively, of which
28
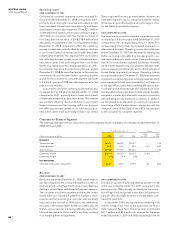
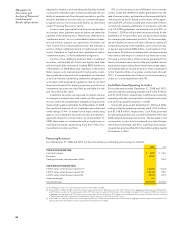
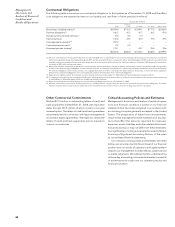
Consumer-to-Business Segment
The following table sets forth our consumer-to-business segment results of operations for the years ended December31,
2008, 2007 and 2006.
Years Ended December 31, % Change
2008 2007
(dollars and transactions in millions) 2008 2007 2006 vs.2007 vs.2006
REVENUES:
Transaction fees $668.1 $665.5 $593.7 — 12%
Other revenues 51.7 54.4 42.5 (5)% 28%
Total revenues $719.8 $719.9 $636.2 — 13%
Operating income $199.4 $223.7 $223.3 (11)% —
Operating margin 28% 31% 35%
KEY INDICATORS:
Consumer-to-business transactions 412.1 404.5 249.4 2% 62%