Western Union 2008 Annual Report Download - page 65
Download and view the complete annual report
Please find page 65 of the 2008 Western Union annual report below. You can navigate through the pages in the report by either clicking on the pages listed below, or by using the keyword search tool below to find specific information within the annual report.-
 1
1 -
2
-
3
-
4
-
5
-
6
-
7
-
8
-
9
-
10
-
11
-
12
-
13
-
14
-
15
-
16
-
17
-
18
-
19
-
20
-
21
-
22
-
23
-
24
-
25
-
26
-
27
-
28
-
29
-
30
-
31
-
32
-
33
-
34
-
35
-
36
-
37
-
38
-
39
-
40
-
41
-
42
-
43
-
44
-
45
-
46
-
47
-
48
-
49
-
50
-
51
-
52
-
53
-
54
-
 55
55 -
 56
56 -
 57
57 -
 58
58 -
 59
59 -
 60
60 -
 61
61 -
 62
62 -
 63
63 -
 64
64 -
 65
65 -
 66
66 -
 67
67 -
 68
68 -
 69
69 -
 70
70 -
 71
71 -
 72
72 -
 73
73 -
 74
74 -
 75
75 -
76
-
77
-
78
-
79
-
80
-
81
-
82
-
83
-
84
 |
 |

6363
Notes to Consolidated
Financial Statements
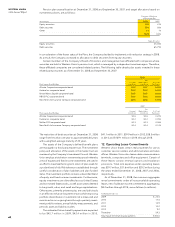
Receivable for securities sold
On September 15, 2008, Western Union requested
redemption of its shares in the Reserve International
Liquidity Fund, Ltd., a money market fund, (the “Fund”)
totaling $298.1 million. The Company had not received any
portion of the redemption payment prior to December 31,
2008, and accordingly, reclassified the total amount due
from “Cash and cash equivalents” to “Other assets” in the
Consolidated Balance Sheet as of December 31, 2008. At
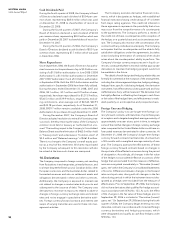
the time the redemption request was made, the Company
was informed by the Reserve Management Company,
the Fund’s investment advisor (the “Manager”), that the
Company’s redemption trades would be honored at a
$1.00 per share net asset value. On January 30, 2009, the
Company received a partial distribution from the Fund
of $193.6 million. The Company expects to receive the
remaining payment based on the maturities of the underly-
ing investments in the Fund and the status of the litigation
process. The Company believes that due to uncertainty
surrounding the outcome of litigation facing the Fund,
as well as potential variability in the ultimate amount and
related timing of the recovery of this balance, the fair value
of this financial asset may be less than the related carrying
value. There is a risk that the redemption process could
be delayed and that the Company could receive less than
the $1.00 per share net asset value should pro-rata dis-
tribution occur. Based on net asset information provided
by the Fund, the Company’s exposure related to pro-rata
distribution could be $12 million, excluding settlement
costs incurred by the Fund. However, based on written
and verbal representations from the Manager to date
and the Company’s current legal position regarding the
Company’s redemption priority, the Company believes
that it is entitled to such funds, and is vigorously pursuing
collection of the remaining distribution.
Amounts advanced to agents, net of discounts
From time to time, the Company makes advances and loans
to agents. In 2006, the Company signed a six year agree-
ment with one of its existing agents which included a four
year loan of $140.0 million to the agent. The terms of the
loan agreement require that a percentage of commissions
earned by the agent (64% in 2009) be withheld by us as
repayment of the loan and the agent remains obligated to
repay the loan if commissions earned are not sufficient. The
Company imputes interest on this below-market rate note
receivable, and has recorded the note net of a discount of
$3.0 million and $22.5 million as of December 31, 2008
and 2007, respectively. The remaining loan receivable
balance relating to this agent as of December 31, 2008 and
2007, net of discount, was $47.0 million and $67.5 million,
respectively. Other advances and loans outstanding as
of December 31, 2008 and 2007 were $22.3 million and
$25.6 million, respectively.
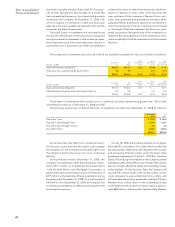
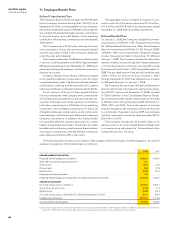
10. Income Taxes
The components of pretax income, generally based on the jurisdiction of the legal entity, are as follows (in millions):
Year Ended December 31, 2008 2007 2006
Components of pretax income:
Domestic $ 416.3 $ 529.3 $ 707.1
Foreign 822.4 693.1 628.0
$1,238.7 $1,222.4 $1,335.1
The provision for income taxes is as follows (in millions):
Year Ended December 31, 2008 2007 2006
Federal $234.8 $287.7 $331.1
State and local 30.3 26.3 34.5
Foreign 54.6 51.1 55.5
$319.7 $365.1 $421.1
Domestic taxes have been incurred on certain pre-tax income amounts that were generated by the Company’s
foreign operations. Accordingly, the percentage obtained by dividing the total federal, state and local tax provision
by the domestic pretax income, all as shown in the preceding tables, may be higher than the statutory tax rates in the
United States.
The Company’s effective tax rates differ from statutory rates as follows:
Year Ended December 31, 2008 2007 2006
Federal statutory rate 35.0% 35.0% 35.0%
State income taxes, net of federal income tax benefits 1.3% 1.7% 2.0%
Foreign rate differential (11.4)% (7.7)% (6.3)%
Federal tax credits —% —% (0.3)%
Other 0.9% 0.9% 1.1%
Effective tax rate 25.8% 29.9% 31.5%