Western Union 2008 Annual Report Download - page 26
Download and view the complete annual report
Please find page 26 of the 2008 Western Union annual report below. You can navigate through the pages in the report by either clicking on the pages listed below, or by using the keyword search tool below to find specific information within the annual report.-
 1
1 -
2
-
3
-
4
-
5
-
6
-
7
-
8
-
9
-
10
-
11
-
12
-
13
-
14
-
15
-
 16
16 -
 17
17 -
 18
18 -
 19
19 -
 20
20 -
 21
21 -
 22
22 -
 23
23 -
 24
24 -
 25
25 -
 26
26 -
 27
27 -
 28
28 -
 29
29 -
 30
30 -
 31
31 -
 32
32 -
 33
33 -
 34
34 -
 35
35 -
 36
36 -
37
-
38
-
39
-
40
-
41
-
42
-
43
-
44
-
45
-
46
-
47
-
48
-
49
-
50
-
51
-
52
-
53
-
54
-
55
-
56
-
57
-
58
-
59
-
60
-
61
-
62
-
63
-
64
-
65
-
66
-
67
-
68
-
69
-
70
-
71
-
72
-
73
-
74
-
75
-
76
-
77
-
78
-
79
-
80
-
81
-
82
-
83
-
84
 |
 |

WESTERN UNION
2008 Annual Report
24
Earnings per share
During the years ended December 31, 2008, 2007 and
2006, basic earnings per share were $1.26, $1.13 and
$1.20, respectively, and diluted earnings per share were
$1.24, $1.11 and $1.19, respectively. All issued and out-
standing shares of Western Union common stock until the
spin-off on September 29, 2006, consisting of 100 shares,
were held by First Data. Accordingly, for all periods pre-
sented prior to the spin-off date of September 29, 2006,
basic and diluted earnings per share were computed
using our basic shares outstanding as of the spin-off date.
Unvested shares of restricted stock are excluded from
basic shares outstanding. Diluted earnings per share
reflects the potential dilution that could occur if outstanding
stock options on the presented dates are exercised and
shares of restricted stock have vested. As of December 31,
2008, 2007 and 2006, there were 8.0 million, 10.4 million
and 4.9 million, respectively, of outstanding options to
purchase shares of Western Union stock excluded from the
diluted earnings per share calculation under the treasury
stock method as their effect is anti-dilutive. The treasury
stock method assumes proceeds from the exercise price
of stock options, the unamortized compensation expense
and assumed tax benefits of options and restricted stock
are available to acquire shares at an average price through-
out the year, and therefore, reduce the dilutive effect
throughout the year. Of the 43.6 million, 59.4 million and
73.8 million outstanding options to purchase shares of
our common stock as of December 31, 2008, 2007 and
2006, respectively, approximately 47%, 58% and 60%,
respectively, are held by employees of First Data.
Diluted earnings per share increased during the year
ended December 31, 2008 compared to 2007 due to
the increased net income as a result of the previously
described factors and lower weighted-average diluted
shares outstanding. The lower number of diluted shares
outstanding was driven by stock repurchases exceeding
stock option exercises in 2008 compared to 2007.
Diluted earnings per share decreased during the year
ended December 31, 2007 compared to the previous
period due to the decrease in net income as a result of the
previously described factors and the increase in diluted
shares outstanding. Prior to the September 29, 2006
spin-off date, there were no potentially dilutive instruments
outstanding and, accordingly, the potentially dilutive shares
arising in connection with the spin-off had minimal impact
to 2006 due to the impact of weighting. In 2007, the dilu-
tive shares outstanding were outstanding for a full year.
Segment Discussion
We manage our business around the consumers we serve
and the types of services we offer. Each of our two seg-
ments addresses a different combination of consumer
groups, distribution networks and services offered. Our
segments are consumer-to-consumer and consumer-to-
business, as described earlier. Businesses not considered
part of these segments are categorized as “Other.”
The business segment measurements provided to, and
evaluated by, our CODM are computed in accordance
with the following principles:
º
The accounting policies of the reporting segments
are the same as those described in the summary of
significant accounting policies.
º
Corporate and other overhead is allocated to the seg-
ments primarily based on a percentage of the seg-
ments’ revenue.
º
Expenses incurred in connection with the development
of certain new service offerings, including costs to
develop mobile money transfer services, new prepaid
service offerings and non-recurring costs incurred to
effect the spin-off are included in “Other.”
º
Restructuring and related activities of $82.9 million
for the year ended December 31, 2008 have not been
allocated to the segments. While these items are iden-
tifiable to our segments, they are not included in the
measurement of segment operating profit provided to
the CODM for purposes of assessing segment perfor-
mance and decision making with respect to resource
allocation. For additional information on restructuring
and related activities refer to “Operating expenses
overview.”
º
All items not included in operating income are
excluded.
24
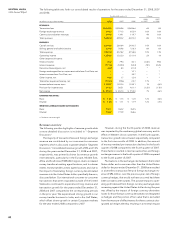
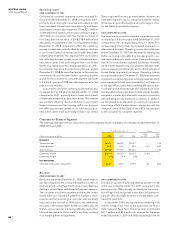
The following table sets forth the components of segment revenues as a percentage of the consolidated totals for the
years ended December31, 2008, 2007 and 2006.
Years Ended December 31, 2008 2007 2006
Consumer-to-consumer (a)
EMEASA 44% 40% 38%
Americas 34% 37% 41%
APAC 7% 6% 5%
Total Consumer-to-consumer 85% 83% 84%
Consumer-to-business 14% 15% 14%
Other 1% 2% 2%
Total 100% 100% 100%
(a) The geographic split is determined based upon the region where the money transfer is initiated and the region where the money transfer is paid. For transactions origi-
nated and paid in different regions, we split the revenue between the two regions, with each region receiving 50%. For money transfers initiated and paid in the same
region, 100% of the revenue is attributed to that region.