Western Union 2008 Annual Report Download - page 27
Download and view the complete annual report
Please find page 27 of the 2008 Western Union annual report below. You can navigate through the pages in the report by either clicking on the pages listed below, or by using the keyword search tool below to find specific information within the annual report.-
 1
1 -
2
-
3
-
4
-
5
-
6
-
7
-
8
-
9
-
10
-
11
-
12
-
13
-
14
-
15
-
16
-
 17
17 -
 18
18 -
 19
19 -
 20
20 -
 21
21 -
 22
22 -
 23
23 -
 24
24 -
 25
25 -
 26
26 -
 27
27 -
 28
28 -
 29
29 -
 30
30 -
 31
31 -
 32
32 -
 33
33 -
 34
34 -
 35
35 -
 36
36 -
 37
37 -
38
-
39
-
40
-
41
-
42
-
43
-
44
-
45
-
46
-
47
-
48
-
49
-
50
-
51
-
52
-
53
-
54
-
55
-
56
-
57
-
58
-
59
-
60
-
61
-
62
-
63
-
64
-
65
-
66
-
67
-
68
-
69
-
70
-
71
-
72
-
73
-
74
-
75
-
76
-
77
-
78
-
79
-
80
-
81
-
82
-
83
-
84
 |
 |

2525
Management’s
Discussion and
Analysis of Financial
Condition and
Results of Operations
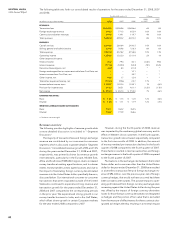
Consumer-to-Consumer Segment
The following table sets forth our consumer-to-consumer segment results of operations for the years ended December31,
2008, 2007 and 2006.
Years Ended December 31, % Change
2008 2007
(dollars and transactions in millions) 2008 2007 2006 vs.2007 vs.2006
REVENUES:
Transaction fees $3,532.9 $3,286.6 $3,059.0 7% 7%
Foreign exchange revenue 893.1 769.3 652.4 16% 18%
Other revenues 45.6 37.2 33.5 23% 11%
Total revenues $4,471.6 $4,093.1 $3,744.9 9% 9%
Operating income $1,222.7 $1,078.3 $1,069.7 13% 1%
Operating margin 27% 26% 29%
KEY INDICATORS:
Consumer-to-consumer transactions 188.1 167.7 147.1 12% 14%
The table below sets forth transaction and revenue growth/(decline) rates by region for the years ended December31,
2008 and 2007.
Years Ended December 31, 2008 2007
Consumer-to-consumer transaction growth (a):
EMEASA 23% 26%
Americas 2% 5%
APAC 27% 34%
Consumer-to-consumer revenue growth/(decline) (a):
EMEASA 16% 18%
Americas (1)% (2)%
APAC 22% 34%
(a) In determining the revenue and transaction growth rates under the regional view in the above table, the geographic split is determined based upon the region where
the money transfer is initiated and the region where the money transfer is paid. For transactions originated and paid in different regions, we split the transaction count
and revenue between the two regions, with each region receiving 50%. For money transfers initiated and paid in the same region, 100% of the revenue and transactions
are attributed to that region.
When referring to revenue and transaction growth
rates for individual countries in the following discussion,
all transactions to, from and within those countries, and
100% of the revenue associated with each transaction to,
from and within those countries are included. India and
China combined represented approximately 6%, 5% and
4% of consolidated Western Union revenues during the
years ended December 31, 2008, 2007 and 2006, respec-
tively. Mexico represented approximately 7%, 7% and 8%
of consolidated Western Union revenues during the years
ended December 31, 2008, 2007 and 2006, respectively.
Revenues overview
2008 COMPARED TO 2007
The primary drivers of consumer-to-consumer revenue
growth are transaction fees and foreign exchange revenue.
Consumer-to-consumer money transfer revenue growth
was 9% for the year ended December 31, 2008 over the
same period in 2007. This increase was driven by revenue
growth of 13% in our international business on transaction
growth of 17%. Our international business represents all
transactions other than transactions between and within
the United States and Canada and transactions to and from
Mexico. Our international consumer-to-consumer business
outside of the United States also continued to experience
strong revenue growth for the year ended December 31,
2008 as a result of strong transaction growth.
However, during the fourth quarter of 2008, revenue
was impacted by the weakening global economy and its
effect on Western Union customers. In the fourth quarter,
transaction growth rates slowed sequentially compared
to the first nine months of 2008. In addition, the amount
of money remitted per transaction declined in the fourth
quarter of 2008 compared to the fourth quarter of 2007.
These factors resulted in less transaction fee and foreign
exchange revenue in the fourth quarter of 2008 compared
to the fourth quarter of 2007.
Revenue growth in our EMEASA region was 16% on
transaction growth of 23% for the year ended December 31,
2008 over the same period in 2007. The growth in our
EMEASA region during the year ended December 31,
2008, was primarily driven by transaction growth and the
impact of translating foreign currency denominated rev-
enues into the United States dollar, specifically the euro,
as further described below. Contributing to the growth in
the EMEASA region was strong transaction growth of over
60% in our money transfer business to India for the year
ended December 31, 2008 compared to the corresponding
period in 2007, resulting in revenue growth of over 45%.
Over the same period, revenue growth in the Gulf States
continued to be strong. However, revenue growth in some
European markets during the year ended December 31,
2008 slowed over the previous year, especially during the
fourth quarter of 2008 as certain countries within Europe,
such as Spain, have experienced declines in the housing
industry and rising unemployment.
Fluctuations in the exchange rate between the United
States dollar and currencies other than the United States dol-
lar for the year ended December 31, 2008 have resulted in a