Western Union 2007 Annual Report Download - page 69
Download and view the complete annual report
Please find page 69 of the 2007 Western Union annual report below. You can navigate through the pages in the report by either clicking on the pages listed below, or by using the keyword search tool below to find specific information within the annual report.-
 1
1 -
2
-
3
-
4
-
5
-
6
-
7
-
8
-
9
-
10
-
11
-
12
-
13
-
14
-
15
-
16
-
17
-
18
-
19
-
20
-
21
-
22
-
23
-
24
-
25
-
26
-
27
-
28
-
29
-
30
-
31
-
32
-
33
-
34
-
35
-
36
-
37
-
38
-
39
-
40
-
41
-
42
-
43
-
44
-
45
-
46
-
47
-
48
-
49
-
50
-
51
-
52
-
53
-
54
-
55
-
56
-
57
-
58
-
 59
59 -
 60
60 -
 61
61 -
 62
62 -
 63
63 -
 64
64 -
 65
65 -
 66
66 -
 67
67 -
 68
68 -
 69
69 -
 70
70 -
 71
71 -
 72
72 -
 73
73 -
 74
74 -
 75
75 -
 76
76 -
 77
77 -
 78
78 -
 79
79 -
80
-
81
-
82
-
83
-
84
 |
 |

67
Notes to Consolidated Financial Statements
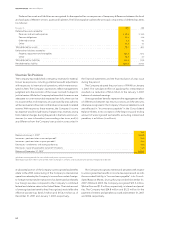
SFAS No. 87 requires the sponsor of a defi ned benefi t plan to
measure the plan’s obligations and annual expense using assump-
tions that refl ect best estimates and are consistent to the extent
that each assumption refl ects expectations of future economic
conditions. As the bulk of the pension benefi ts will not be paid
for many years, the computation of pension expenses and benefi ts
is based on assumptions about future interest rates and expected
rates of return on plan assets. In general, pension obligations
are most sensitive to the discount rate assumption, and it is set
based on the rate at which the pension benefi ts could be settled
effectively. The discount rate is determined by matching the
timing and amount of anticipated payouts under the plans to
the rates from a AA spot rate yield curve. The curve is derived
from AA bonds of varying maturities.
Western Union employs a building block approach in deter-
mining the long-term rate of return for plan assets. Historical
markets are studied and long-term historical relationships between
equities and fi xed-income securities are preserved consistent
with the widely accepted capital market principle that assets
with higher volatility generate a greater return over the long run.
Current market factors such as infl ation and interest rates are
evaluated before long-term capital market assumptions are
determined. The long-term portfolio return is established using
a building block approach with proper consideration of diver-
sifi cation and re-balancing. Peer data and historical returns are
reviewed to check for reasonableness and appropriateness.
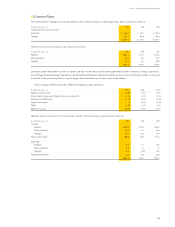
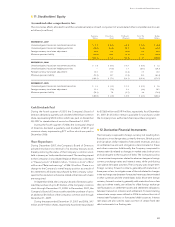
The following table provides the components of net periodic benefi t income for the plans (in millions):
December 31, 2007 2006 2005
Interest cost $ 24.6 $ 24.8 $ 25.6
Expected return on plan assets (28.4) (29.9) (33.8)
Amortization of unrecognized actuarial loss 3.6 4.2 2.7
Net periodic benefi t income $ (0.2) $ (0.9) $ (5.5)
The pension liability included in other comprehensive income/(loss), net of tax, decreased $15.3 million, $10.8 million and $4.9 million
in 2007, 2006 and 2005, respectively.
The weighted-average rate assumptions used in the measurement of the Company’s benefi t obligation are as follows:
2007 2006
Discount rate 6.02% 5.61%
The weighted-average rate assumptions used in the measurement of the Company’s net cost (income) are as follows:
2007 2006 2005
Discount rate 5.62% 5.24% 5.19%
Expected long-term return on plan assets 7.50% 7.50% 7.75%
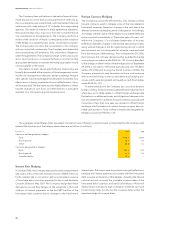
Pension plan asset allocation at September 30, 2007 and 2006, and target allocations based on investment policies, are
as follows:
Percentage of Plan Assets
at Measurement Date
Asset Category 2007 2006
Equity securities 41% 40%
Debt securities 58% 58%
Other 1% 2%
100% 100%
Target Allocation
Equity securities 30-50%
Debt securities 55-65%
Other 0-10%