Western Union 2007 Annual Report Download - page 33
Download and view the complete annual report
Please find page 33 of the 2007 Western Union annual report below. You can navigate through the pages in the report by either clicking on the pages listed below, or by using the keyword search tool below to find specific information within the annual report.-
 1
1 -
2
-
3
-
4
-
5
-
6
-
7
-
8
-
9
-
10
-
11
-
12
-
13
-
14
-
15
-
16
-
17
-
18
-
19
-
20
-
21
-
22
-
 23
23 -
 24
24 -
 25
25 -
 26
26 -
 27
27 -
 28
28 -
 29
29 -
 30
30 -
 31
31 -
 32
32 -
 33
33 -
 34
34 -
 35
35 -
 36
36 -
 37
37 -
 38
38 -
 39
39 -
 40
40 -
 41
41 -
 42
42 -
 43
43 -
44
-
45
-
46
-
47
-
48
-
49
-
50
-
51
-
52
-
53
-
54
-
55
-
56
-
57
-
58
-
59
-
60
-
61
-
62
-
63
-
64
-
65
-
66
-
67
-
68
-
69
-
70
-
71
-
72
-
73
-
74
-
75
-
76
-
77
-
78
-
79
-
80
-
81
-
82
-
83
-
84
 |
 |

Management’s Discussion and Analysis of Financial Condition and Results of Operations
31
outside of Arizona, which efforts Western Union has resisted in
court. We believe that these events and the publicity they created
led some consumers to avoid Western Union’s services in late
2006 and early 2007. Western Union remains in litigation with
the Arizona Attorney General on these matters. We believe that
our legal position is sound, and the publicity surrounding these
matters has largely abated.
Domestic transaction growth rates in the year ended Decem-
ber 31, 2006 over the same period in 2005 declined compared
to increases observed for the year 2005 due in part to the uncer-
tainty created by the immigration debate described above, and
broader market softness experienced within the United States
domestic business in 2006.
Growth in Mexico money transfer transactions for the year
ended December 31, 2006 compared to the same period in 2005
was driven by the acquisition of Vigo and growth in Western
Union branded transactions. The decline in revenue growth
rates was primarily due to the uncertainty created by the immigra-
tion debate in the United States as described above.
Foreign exchange revenue increased for the year ended
December 31, 2006 due to the acquisition of Vigo and an increase
in the higher growth international business resulting in increased
cross-currency transactions.
Operating income
The consumer-to-consumer segment’s operating income increased
by 1% for the year ended December 31, 2007 compared to the
corresponding period in 2006. This increase was primarily driven
by increased revenue in our international business. Operating
income during the year ended December 31, 2007 was impacted
by the ongoing shift in our business mix refl ecting stronger
growth in our international business, which carries lower profi t
margins than in our United States originated businesses. However,
we have been experiencing a convergence between international
operating profi t margins and profi t margins of our United States
originated businesses. Operating income during the year ended
December 31, 2007 was adversely impacted by incremental
public company expenses which are incremental to both costs
allocated by First Data prior to the spin-off and presumed over-
head allocations from First Data had we remained part of First
Data. Such incremental public company expenses include salaries,
benefi ts, equipment, supplies and other costs incurred in con-
nection with operating as a separate public company. In addition,
we recognized an accelerated non-cash stock compensation
charge of $22.3 million taken in connection with the change in
control of First Data, of which 85% was allocated to the consumer-
to-consumer segment.
The consumer-to-consumer segment’s operating income
increased for the year ended December 31, 2006 compared to the
same period in 2005 due to an increase in revenue and by lower
escheatment accruals resulting from charges incurred in 2005
that did not recur in 2006. These benefi ts to operating income
during the year ended December 31, 2006 were partially offset by
the ongoing shift in our business mix refl ecting stronger growth
in our international business, and incremental public company
expenses as discussed above. In addition, we incurred higher
employee incentive compensation expenses, including those
incurred in connection with the adoption of SFAS No. 123R.
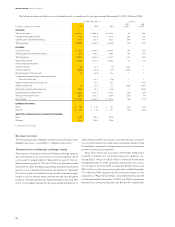
Consumer-to-Business Segment
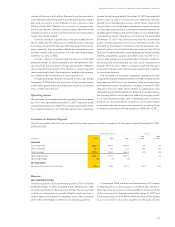
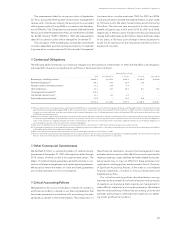
The following table sets forth our consumer-to-business segment results of operations for the years ended December 31, 2007,
2006 and 2005.
Year Ended December 31, % Change
2007 2006
(in millions) 2007 2006 2005 vs. 2006 vs. 2005
REVENUES:
Transaction fees $665.5 $593.7 $565.0 12% 5%
Other revenues 54.4 42.5 35.2 28% 21%
Total revenues $719.9 $636.2 $600.2 13% 6%
Operating income $223.7 $223.3 $220.4 — 1%
Operating margin 31% 35% 37%
KEY INDICATORS:
Consumer-to-business transactions 404.5 249.4 215.1 62% 16%
Revenues
2007 COMPARED TO 2006
Transaction growth of 62% and revenue growth of 13% in the year
ended December 31, 2007 compared to the same period in 2006
primarily resulted from the acquisition of Pago Fácil and growth
in electronic bill payments, partially offset by slight de clines in
United States cash-based bill payments due to the continued
shift in the United States to electronic-based bill payments.
In December 2006, we acquired the remaining 75% interest
in Pago Fácil. Prior to the acquisition, we held a 25% interest in
Pago Fácil. This acquisition contributed $67.7 million and $3.6
million in revenue for the years ended December 31, 2007 and
2006, respectively, of which $64.4 million and $3.6 million related
to our consumer-to-business segment in the years ended