Western Union 2007 Annual Report Download - page 28
Download and view the complete annual report
Please find page 28 of the 2007 Western Union annual report below. You can navigate through the pages in the report by either clicking on the pages listed below, or by using the keyword search tool below to find specific information within the annual report.-
 1
1 -
2
-
3
-
4
-
5
-
6
-
7
-
8
-
9
-
10
-
11
-
12
-
13
-
14
-
15
-
16
-
17
-
 18
18 -
 19
19 -
 20
20 -
 21
21 -
 22
22 -
 23
23 -
 24
24 -
 25
25 -
 26
26 -
 27
27 -
 28
28 -
 29
29 -
 30
30 -
 31
31 -
 32
32 -
 33
33 -
 34
34 -
 35
35 -
 36
36 -
 37
37 -
 38
38 -
39
-
40
-
41
-
42
-
43
-
44
-
45
-
46
-
47
-
48
-
49
-
50
-
51
-
52
-
53
-
54
-
55
-
56
-
57
-
58
-
59
-
60
-
61
-
62
-
63
-
64
-
65
-
66
-
67
-
68
-
69
-
70
-
71
-
72
-
73
-
74
-
75
-
76
-
77
-
78
-
79
-
80
-
81
-
82
-
83
-
84
 |
 |
26
WESTERN UNION 2007 Annual Report
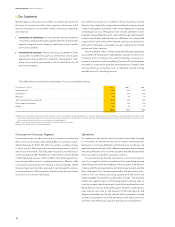
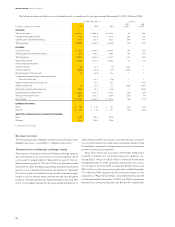
Cost of services
Cost of services is primarily comprised of agent commissions
and also includes expenses for personnel, software, equipment,
telecommunications, bank fees, depreciation and amortization
and other expenses incurred in connection with providing money
transfer and other payment services. Cost of services was 57%,
54%, and 53% of consolidated revenue for the years ended
December 31, 2007, 2006 and 2005, respectively. Overall, agent
renewals in 2007 resulted in commission rates materially consistent
with previous agreements.
The majority of the increase in cost of services as a percentage
of revenue in 2007 compared to the corresponding period in
2006 was attributable to the shift in our business mix refl ecting
stronger growth from our international business, which carries
higher cost of services compared to our United States originated
businesses. The Pago Fácil business, which carries a lower margin
than our existing consumer-to-business services, also contributed
to the increase in cost of services. The stock compensation charge
resulting from the acquisition of First Data by an affi liate of KKR
and incremental public company expenses were additional factors
leading to the increase in cost of services in 2007, and caused
cost of services to increase at a higher rate between 2007 and
2006 compared to the increase in 2006 compared to 2005.
The majority of the increase in cost of services for the year
ended December 31, 2006 compared to 2005 was attributable
to the shift in our business mix refl ecting stronger growth from
our international business, as described above. Another factor
impacting cost of services as a percent of revenue was the
October 2005 acquisition of Vigo, which has higher cost of
services compared to Western Union branded money transfers.
Higher stock compensation costs in connection with the adoption
of SFAS No. 123R, and higher employee incentive compensation
expense also contributed to the increase in cost of services as a
percent of revenue.
Selling, general and administrative
Selling, general and administrative expenses increased for the
year ended December 31, 2007 compared to the corresponding
period in the prior year primarily due to incremental public
company expenses and the stock compensation charge related
to KKR’s acquisition of First Data, as described above. In addition,
costs associated with the inclusion of the Pago Fácil business
contributed to the increase in 2007 from 2006.
Selling, general and administrative expenses increased for
the year ended December 31, 2006 compared to the correspond-
ing period in the prior year due primarily to Vigo, incremental
public company expenses, as discussed above, higher stock
compensation expense from the adoption of SFAS No. 123R and
higher employee incentive compensation expenses in 2006
compared to 2005.
Marketing related expenditures, principally classifi ed within
“selling, general and administrative” expenses, increased during
the years ended December 31, 2007 and 2006 compared to the
corresponding periods in the prior years. However, marketing
related expenditures as a percent of consolidated revenue were
approximately 6.0%, 6.5% and 6.9% during the years ended
December 31, 2007, 2006 and 2005, respectively. Marketing
related expenditures include advertising, events, loyalty programs
and the cost of employees dedicated to marketing activities.
When making decisions with respect to marketing investments,
we review opportunities for advertising and other marketing
related expenditures together with opportunities for pricing
adjustments and other initiatives in order to best maximize the
return on these investments. For further discussion regarding the
impact of pricing decreases refer to the “Transaction fees and
foreign exchange revenue” discussion within the consumer-to-
consumer segment section.
Interest income
Interest income increased during the years ended December 31,
2007 and 2006 compared to corresponding periods in the prior
years due to higher international cash balances resulting from
the net cash received in connection with the settlement of inter-
company notes with First Data (net of certain other payments
made to First Data) on the spin-off date, and from cash generated
through our international operations. Also contributing to higher
interest income in 2007 and 2006 was interest income recorded
in connection with a $140.0 million loan made to one of our
agents in the fi rst quarter of 2006.
Interest expense
Interest expense increased to $189.0 million for the year ended
December 31, 2007 compared to $53.4 million during 2006, due
to interest expense on our outstanding borrowings that arose in
connection with the spin-off on September 29, 2006. Interest
expense was signifi cantly higher in 2007 since the related bor-
rowings were outstanding for the full year 2007 compared to
three months during 2006.
Derivative gains/(losses), net
Our foreign currency forward contracts that did not qualify as
hedges under applicable derivative accounting rules were held
primarily in the euro and British pound and had maturities of one
year or less. Prior to September 29, 2006, we did not have any
forward contracts that qualifi ed as hedges, and therefore the
unrealized gains and losses on these contracts were refl ected
within this line item in the consolidated statements of income
prior to that date. Since these instruments did not qualify for
hedge accounting treatment, there was resulting volatility in our
net income for the periods presented prior to September 29,
2006. For example, during the years ended December 31, 2006
and 2005, we had pre-tax derivative (losses)/gains of $(21.2)
million and $45.8 million, respectively.
On September 29, 2006, we established our foreign currency
forward positions to qualify for cash fl ow hedge accounting. We
anticipate the amounts refl ected in this income statement caption
going forward will be minimal, as such amounts will relate primarily
to the portion of the change in fair value that is considered inef-
fective or is excluded from the measure of effectiveness related
to contracts designated as accounting hedges.