Western Union 2007 Annual Report Download - page 26
Download and view the complete annual report
Please find page 26 of the 2007 Western Union annual report below. You can navigate through the pages in the report by either clicking on the pages listed below, or by using the keyword search tool below to find specific information within the annual report.-
 1
1 -
2
-
3
-
4
-
5
-
6
-
7
-
8
-
9
-
10
-
11
-
12
-
13
-
14
-
15
-
 16
16 -
 17
17 -
 18
18 -
 19
19 -
 20
20 -
 21
21 -
 22
22 -
 23
23 -
 24
24 -
 25
25 -
 26
26 -
 27
27 -
 28
28 -
 29
29 -
 30
30 -
 31
31 -
 32
32 -
 33
33 -
 34
34 -
 35
35 -
 36
36 -
37
-
38
-
39
-
40
-
41
-
42
-
43
-
44
-
45
-
46
-
47
-
48
-
49
-
50
-
51
-
52
-
53
-
54
-
55
-
56
-
57
-
58
-
59
-
60
-
61
-
62
-
63
-
64
-
65
-
66
-
67
-
68
-
69
-
70
-
71
-
72
-
73
-
74
-
75
-
76
-
77
-
78
-
79
-
80
-
81
-
82
-
83
-
84
 |
 |

24
WESTERN UNION 2007 Annual Report
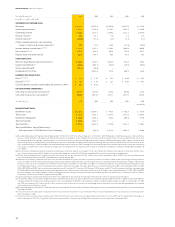
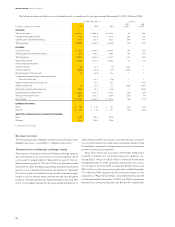
The following table sets forth our consolidated results of operations for the years ended December 31, 2007, 2006 and 2005.
Year Ended December 31, % Change
2007 2006
(in millions, except per share amounts) 2007 2006 2005 vs. 2006 vs. 2005
REVENUES:
Transaction fees $3,989.8 $3,696.6 $3,354.8 8% 10%
Foreign exchange revenue 771.3 653.9 531.0 18% 23%
Commission and other revenues 139.1 119.7 102.1 16% 17%
Total revenues 4,900.2 4,470.2 3,987.9 10% 12%
EXPENSES:
Cost of services 2,808.4 2,430.5 2,118.9 16% 15%
Selling, general and administrative 769.8 728.3 599.8 6% 21%
Total expenses 3,578.2 3,158.8 2,718.7 13% 16%
Operating income 1,322.0 1,311.4 1,269.2 1% 3%
Other (expense)/income:
Interest income 79.4 40.1 7.6 98% *
Interest expense (189.0) (53.4) (1.7) 254% *
Derivative gains/(losses), net 8.3 (21.2) 45.8 * *
Foreign exchange effect on notes receivable
from First Data, net — 10.1 (5.9) * *
Interest income from First Data, net — 35.7 24.3 * 47%
Other income, net 1.7 12.4 4.8 (86)% 158%
Total other (expense)/income, net
(99.6) 23.7 74.9 * (68)%
Income before income taxes 1,222.4 1,335.1 1,344.1 (8)% (1)%
Provision for income taxes 365.1 421.1 416.7 (13)% 1%
Net income $ 857.3 $ 914.0 $ 927.4 (6)% (1)%
EARNINGS PER SHARE:
Basic $ 1.13 $ 1.20 $ 1.21 (6)% (1)%
Diluted $ 1.11 $ 1.19 $ 1.21 (7)% (2)%
WEIGHTED-AVERAGE DILUTED SHARES OUTSTANDING:
Basic 760.2 764.5 763.9
Diluted 772.9 768.6 763.9
* Calculation not meaningful
Revenues overview
The following provides highlights of revenue growth while a more
detailed discussion is included in “— Segment Discussion”:
Transaction fees and foreign exchange revenue
The majority of transaction fees and foreign exchange revenue
are contributed by our consumer-to-consumer segment, which
is discussed in greater detail in “Segment Discussion.” Consoli-
dated revenue growth of 10% and 12% during the years ended
December 31, 2007 and 2006, respectively, was driven by revenue
growth in our international business (as defi ned in “Segment
Discussion”) due to increased money transfers at existing agent
locations, and to a lesser extent, money transfers at new agent
locations. International revenue represented 65%, 62% and 59%
of our consolidated revenue for the years ended December 31,
2007, 2006 and 2005, respectively. Our international consumer-
to-consumer transactions that were originated outside of the
United States continued to display strong transaction and revenue
growth for all periods presented.
Pago Fácil, which was acquired in December 2006 and is
primarily included in our consumer-to-business segment, con-
tributed $67.7 million and $3.6 million of revenue for the years
ended December 31, 2007 and 2006, respectively. Our acquisi-
tion of Vigo in October 2005 contributed $140.5 million and
$24.2 million in total revenue during the years ended December
31, 2006 and 2005, respectively. Excluding the impact of the
acquisitions of Pago Fácil and Vigo, consolidated revenue growth
for the years ended December 31, 2007 and 2006 compared to
the previous corresponding years was 8% and 9%, respectively.