Western Union 2007 Annual Report Download - page 51
Download and view the complete annual report
Please find page 51 of the 2007 Western Union annual report below. You can navigate through the pages in the report by either clicking on the pages listed below, or by using the keyword search tool below to find specific information within the annual report.-
 1
1 -
2
-
3
-
4
-
5
-
6
-
7
-
8
-
9
-
10
-
11
-
12
-
13
-
14
-
15
-
16
-
17
-
18
-
19
-
20
-
21
-
22
-
23
-
24
-
25
-
26
-
27
-
28
-
29
-
30
-
31
-
32
-
33
-
34
-
35
-
36
-
37
-
38
-
39
-
40
-
 41
41 -
 42
42 -
 43
43 -
 44
44 -
 45
45 -
 46
46 -
 47
47 -
 48
48 -
 49
49 -
 50
50 -
 51
51 -
 52
52 -
 53
53 -
 54
54 -
 55
55 -
 56
56 -
 57
57 -
 58
58 -
 59
59 -
 60
60 -
 61
61 -
62
-
63
-
64
-
65
-
66
-
67
-
68
-
69
-
70
-
71
-
72
-
73
-
74
-
75
-
76
-
77
-
78
-
79
-
80
-
81
-
82
-
83
-
84
 |
 |

49
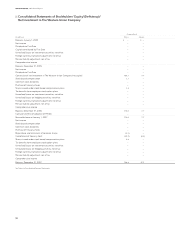
Consolidated Financial Statements
||
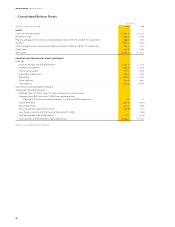
Consolidated Statements of Cash Flows
Year Ended December 31,
(in millions, except per share amounts) 2007 2006 2005
CASH FLOWS FROM OPERATING ACTIVITIES
Net income $ 857.3 $ 914.0 $ 927.4
Adjustments to reconcile net income to net cash provided by operating activities:
Depreciation 49.1 34.8 32.0
Amortization 74.8 68.7 47.5
Deferred income tax provision 4.2 12.9 24.9
Realized (gain)/loss on derivative instruments — (4.1) 0.5
Stock compensation expense 50.2 23.3 —
Other non-cash items, net 14.6 24.3 25.8
Increase/(decrease) in cash, excluding the effects of acquisitions
and dispositions, resulting from changes in:
Other assets 16.2 (60.7) (8.8)
Accounts payable and accrued liabilities 43.4 59.8 (26.1)
Income tax payable 15.3 63.4 8.2
Other liabilities (21.6) (27.5) (28.6)
Net cash provided by operating activities 1,103.5 1,108.9 1,002.8
CASH FLOWS FROM INVESTING ACTIVITIES
Capitalization of contract costs (80.9) (124.1) (22.5)
Capitalization of purchased and developed software (27.7) (14.4) (7.7)
Purchases of property and equipment (83.5) (63.8) (34.8)
Notes receivable issued to agents (6.1) (140.0) (8.4)
Repayments of notes receivable issued to agents 32.0 20.0 —
Acquisition of businesses, net of cash acquired and contingent purchase consideration paid — (66.5) (349.1)
Cash received/(paid) on maturity of foreign currency forwards — 4.1 (0.5)
Purchase of equity method investments (35.8) — (5.4)
Net cash used in investing activities (202.0) (384.7) (428.4)
CASH FLOWS FROM FINANCING ACTIVITIES
Net proceeds from commercial paper 13.6 324.6 —
Net (repayments of)/proceeds from net borrowings under credit facilities (3.0) 3.0 —
Proceeds from exercise of options 216.1 80.8 —
Cash dividends to public stockholders (30.0) (7.7) —
Common stock repurchased (726.8) (19.9) —
Advances from/(to) affi liates of First Data — 160.2 (153.2)
Capital contributed by First Data in connection with acquisitions — — 369.2
Notes payable issued to First Data — — 400.1
Repayments of notes payable to First Data — (154.5) (246.5)
Additions to notes receivable from First Data — (7.5) (504.7)
Proceeds from repayments of notes receivable from First Data — 776.2 18.4
Dividends to First Data — (2,953.9) (417.2)
Proceeds from issuance of debt — 4,386.0 —
Principal payments on borrowings — (2,400.0) —
Net cash (used in)/provided by fi nancing activities (530.1) 187.3 (533.9)
Net change in cash and cash equivalents 371.4 911.5 40.5
Cash and cash equivalents at beginning of year 1,421.7 510.2 469.7
Cash and cash equivalents at end of year $1,793.1 $1,421.7 $ 510.2
SUPPLEMENTAL CASH FLOW INFORMATION
Interest paid (prior to the September 29, 2006 spin-off,
amounts were paid primarily to First Data) $ 185.8 $ 26.4 $ 3.5
Income taxes paid (prior to the September 29, 2006 spin-off,
amounts were paid primarily to First Data) 340.9 271.6 391.8
Notes issued in conjunction with dividend to First Data,
net of debt issue costs and discount — 995.1 —
Net liabilities transferred from First Data in connection
with the September 29, 2006 spin-off — 148.2 —
See Notes to Consolidated Financial Statements.