Western Union 2007 Annual Report Download - page 36
Download and view the complete annual report
Please find page 36 of the 2007 Western Union annual report below. You can navigate through the pages in the report by either clicking on the pages listed below, or by using the keyword search tool below to find specific information within the annual report.-
 1
1 -
2
-
3
-
4
-
5
-
6
-
7
-
8
-
9
-
10
-
11
-
12
-
13
-
14
-
15
-
16
-
17
-
18
-
19
-
20
-
21
-
22
-
23
-
24
-
25
-
 26
26 -
 27
27 -
 28
28 -
 29
29 -
 30
30 -
 31
31 -
 32
32 -
 33
33 -
 34
34 -
 35
35 -
 36
36 -
 37
37 -
 38
38 -
 39
39 -
 40
40 -
 41
41 -
 42
42 -
 43
43 -
 44
44 -
 45
45 -
 46
46 -
47
-
48
-
49
-
50
-
51
-
52
-
53
-
54
-
55
-
56
-
57
-
58
-
59
-
60
-
61
-
62
-
63
-
64
-
65
-
66
-
67
-
68
-
69
-
70
-
71
-
72
-
73
-
74
-
75
-
76
-
77
-
78
-
79
-
80
-
81
-
82
-
83
-
84
 |
 |

34
WESTERN UNION 2007 Annual Report
Cash Flows from Operating Activities
During the years ended December 31, 2007 and 2006, cash
provided by operating activities was $1,103.5 million and $1,108.9
million, respectively. Cash fl ows provided by operating activities
was consistent between 2007 and 2006, despite decreased net
income. The decrease in net income was, in part, due to increased
non-cash charges which did not decrease cash fl ows. Cash fl ows
from operating activities also benefi ted from favorable working
capital fl uctuations in 2007.
Cash provided by operating activities increased to $1,108.9
million during the year ended December 31, 2006 compared
to $1,002.8 million for the year ended December 31, 2005 driven
by consumer-to-consumer transaction growth, despite a slight
decrease in net income. Net income for the year ended December
31, 2006 was negatively impacted by higher non-cash charges
that did not impact cash fl ows relating to stock compensation
in connection with the adoption of SFAS No. 123R in 2006, higher
amortization expense related to higher intangible asset balances
in connection with the acquisition of Vigo, and also higher
amortization expense as a result of certain large strategic agent
contracts being executed earlier in the year for which initial
payments were made. The increase in cash fl ow provided by
operating activities also benefi ted from the delay in the payment
of accrued income taxes from 2006 to 2007 discussed above,
while income taxes relating to all four quarters in 2005 were
paid to First Data during 2005.
Financing Resources
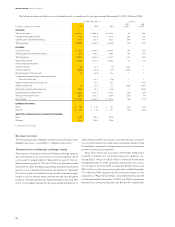
As of December 31, 2007 and 2006, we have the following outstanding borrowings (in millions):
2007 2006
Due in less than one year:
Commercial paper $ 338.2 $ 324.6
Note payable, due January 2007 — 3.0
Floating rate notes, due 2008 500.0 —
Due in greater than one year:
Floating rate notes, due 2008 — 500.0
5.400% notes, net of discount, due 2011(a) 1,002.8 999.0
5.930% notes, net of discount, due 2016 999.7 999.7
6.200% notes, net of discount, due 2036 497.3 497.2
Total borrowings $3,338.0 $3,323.5
(a) Includes the fair market value of $3.6 million relating to an interest rate swap with a notional amount of $75.0 million.
Commercial Paper
Pursuant to our commercial paper program, we may issue unse-
cured commercial paper notes in an amount not to exceed $1.5
billion outstanding at any time. Our commercial paper borrowings
may have maturities of up to 397 days from date of issuance.
Interest rates for borrowings are based on market rates at the
time of issuance. Our commercial paper borrowings at December
31, 2007 and 2006 had a weighted-average interest rate of
approximately 5.5% and 5.4% and a weighted-average initial
term of 36 days and 17 days, respectively.
Revolving Credit Facility
Our revolving credit facility expires in 2012 and includes a $1.5
billion revolving credit facility, a $250.0 million letter of credit
sub-facility and a $150.0 million swing line sub-facility (the
“Revolving Credit Facility”). Interest due under the Revolving
Credit Facility is fi xed for the term of each borrowing and is
payable according to the terms of that borrowing. Generally,
interest is calculated using LIBOR plus an interest rate margin
(19 basis points as of December 31, 2007 and 2006). A facility
fee is payable quarterly on the total facility, regardless of usage
(6 basis points as of December 31, 2007 and 2006). The facility
fee percentage is determined based on our credit rating assigned
by Standard & Poor’s Ratings Services (“S&P”) and/or Moody’s
Investor Services, Inc. (“Moody’s”). In addition, to the extent the
aggregate outstanding borrowings under the Revolving Credit
Facility exceed 50% of the related aggregate commitments, a
utilization fee based upon such ratings is payable to the lenders
on the aggregate outstanding borrowings (5 basis points as of
December 31, 2007 and 2006).
As of December 31, 2007, we had no outstanding borrowings
and had approximately $1.2 billion available for borrowings
under our Revolving Credit Facility. Our revolving credit facility
is used to provide general liquidity for the Company and to
support our commercial paper program, which we believe
enhances our short term credit rating. If the amount available to
borrow under the revolving credit facility decreased, or if the
revolving credit facility were eliminated, the cost and availability
of borrowing under the commercial paper program may be
impacted. Amounts available to borrow under this facility are
limited by outstanding commercial paper borrowings.