Vodafone 2001 Annual Report Download - page 63
Download and view the complete annual report
Please find page 63 of the 2001 Vodafone annual report below. You can navigate through the pages in the report by either clicking on the pages listed below, or by using the keyword search tool below to find specific information within the annual report.-
 1
1 -
2
-
3
-
4
-
5
-
6
-
7
-
8
-
9
-
10
-
11
-
12
-
13
-
14
-
15
-
16
-
17
-
18
-
19
-
20
-
21
-
22
-
23
-
24
-
25
-
26
-
27
-
28
-
29
-
30
-
31
-
32
-
33
-
34
-
35
-
36
-
37
-
38
-
39
-
40
-
41
-
42
-
43
-
44
-
45
-
46
-
47
-
48
-
49
-
50
-
51
-
52
-
 53
53 -
 54
54 -
 55
55 -
 56
56 -
 57
57 -
 58
58 -
 59
59 -
 60
60 -
 61
61 -
 62
62 -
 63
63 -
 64
64 -
 65
65 -
 66
66 -
 67
67 -
 68
68
 |
 |

Vodafone Group Plc
Annual Report & Accounts
for the year ended
31 March 2001
61
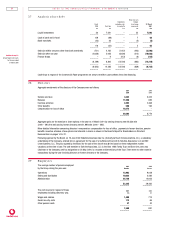
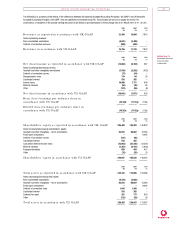
UNITED STATES ACCOUNTING PRINCIPLES
The following is a summary of the effects of the differences between US Generally Accepted Accounting Principles (“US GAAP”) and UK Generally
Accepted Accounting Principles (“UK GAAP”) that are significant to Vodafone Group Plc. The principles are set out on pages 62 and 63. For
convenience, a translation of the pounds sterling amounts into US dollars is provided based on the exchange rate at 31 March 2001 of £1 = $1.42.
2001 2001 2000
$m £m £m
Revenues as reported in accordan ce with UK GAAP 21,306 15,004 7,873
Items decreasing revenues:
Non-consolidated subsidiaries (4,841) (3,409) –
Deferral of connection revenues (699) (492) –
––––––– ––––––– –––––––
Revenues in accordan ce with US GAAP 15,766 11,103 7,873
––––––– ––––––– –––––––
2001 2001 2000
$m £m £m
Net (loss)/in com e as reported in accordan ce with UK GAAP (13,863) (9,763) 487
Items (increasing)/decreasing net loss:
Goodwill and other intangibles amortisation (7,516) (5,293) (425)
Deferral of connection income (77) (54) –
Reorganisation costs 119 84 25
Capitalised interest 518 365 –
Income taxes 10,950 7,711 439
Minority interests (50) (35) 35
Other (122) (86) (8)
––––––– ––––––– –––––––
Net (loss)/in com e in accordan ce with US GAAP (10,041) (7,071) 553
––––––– ––––––– –––––––
Basic (loss)/earnin gs per ordin ary sh are in
accordan ce with US GAAP (16.34)¢ (11.51)p 2.04p
––––––– ––––––– –––––––
Diluted (loss)/earnin gs per ordin ary sh are in
accordan ce with US GAAP (16.35)¢ (11.52)p 2.02p
––––––– ––––––– –––––––
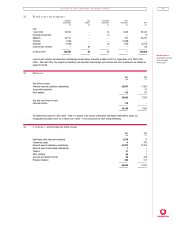
2001 2001 2000
$m £m £m
Sh areholders’ equity as rep orted in accordan ce with UK GAAP 206,458 145,393 140,833
Items increasing/(decreasing) shareholders’ equity:
Goodwill and other intangibles – net of amortisation 93,815 66,067 10,283
Fixed asset investments ––9,054
Deferral of connection income (121) (85) –
Capitalised interest 518 365 –
Cumulative deferred income taxes (73,053) (51,446) (12,334)
Minority interests (7,357) (5,181) (1,939)
Proposed dividends 659 464 417
Other (78) (55) 20
––––––– ––––––– –––––––
Sh areholders’ equity in accordan ce with US GAAP 220,841 155,522 146,334
––––––– ––––––– –––––––
2001 2001 2000
$m £m £m
Total assets as reported in accordan ce with UK GAAP 244,332 172,065 153,368
Items (decreasing)/increasing total assets:
Non-consolidated subsidiaries (4,234) (2,982) –
Goodwill and other intangibles – net of amortisation 93,815 66,067 10,283
Fixed asset investments ––9,054
Deferral of connection costs 1,943 1,368 –
Capitalised interest 518 365 –
Deferred tax asset 251 177 616
Other (132) (93) 26
––––––– ––––––– –––––––
Total assets in accordan ce with US GAAP 336,493 236,967 173,347
––––––– ––––––– –––––––