Vodafone 2001 Annual Report Download - page 27
Download and view the complete annual report
Please find page 27 of the 2001 Vodafone annual report below. You can navigate through the pages in the report by either clicking on the pages listed below, or by using the keyword search tool below to find specific information within the annual report.-
 1
1 -
2
-
3
-
4
-
5
-
6
-
7
-
8
-
9
-
10
-
11
-
12
-
13
-
14
-
15
-
16
-
 17
17 -
 18
18 -
 19
19 -
 20
20 -
 21
21 -
 22
22 -
 23
23 -
 24
24 -
 25
25 -
 26
26 -
 27
27 -
 28
28 -
 29
29 -
 30
30 -
 31
31 -
 32
32 -
 33
33 -
 34
34 -
 35
35 -
 36
36 -
 37
37 -
38
-
39
-
40
-
41
-
42
-
43
-
44
-
45
-
46
-
47
-
48
-
49
-
50
-
51
-
52
-
53
-
54
-
55
-
56
-
57
-
58
-
59
-
60
-
61
-
62
-
63
-
64
-
65
-
66
-
67
-
68
 |
 |

Vodafone Group Plc
Annual Report & Accounts
for the year ended
31 March 2001
25
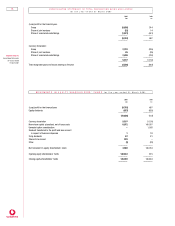
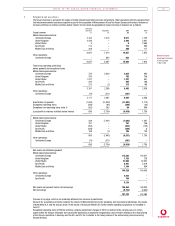
CONSOLIDATED PROFIT AND LOSS ACCOUNT for the year ended 31 March 2001
2001 2000
Note £m £m
Turnover: Group and share of joint ventures and associated undertakings
Continuing operations 15,155 11,521
Acquisitions 8,838 –
–––––––– ––––––––
23,993 11,521
Less: Share of joint ventures 1(98) (362)
Share of associated undertakings 1(8,891) (3,286)
–––––––– ––––––––
15,004 7,873
–––––––– ––––––––
Group turnover
Continuing operations 6,637 7,873
Acquisitions 8,367 –
–––––––– ––––––––
115,004 7,873
–––––––– ––––––––
Operating (loss)/profit
Continuing operations 1,044 981
Acquisitions (7,483) –
–––––––– ––––––––
2(6,439) 981
Share of operating loss in joint ventures and associated undertakings
Continuing operations (26) (185)
Acquisitions (533) –
–––––––– ––––––––
2(559) (185)
Total Group operating (loss)/profit: Group and share of joint ventures
and associated undertakings (6,998) 796
Exceptional non-operating items 380 954
–––––––– ––––––––
(Loss)/profit on ordinary activities before interest 1(6,918) 1,750
Net interest payable 4(1,177) (401)
Group (850) (350)
Share of joint ventures and associated undertakings (327) (51)
–––––––– ––––––––
(Loss)/profit on ordinary activities before taxation (8,095) 1,349
Tax on (loss)/profit on ordinary activities 5(1,290) (685)
Group (1,118) (494)
Share of joint ventures and associated undertakings (172) (191)
–––––––– ––––––––
(Loss)/profit on ordinary activities after taxation (9,385) 664
Equity minority interests (319) (137)
Non-equity minority interests (59) (40)
–––––––– ––––––––
(Loss)/profit for the financial year (9,763) 487
Equity dividends 6(887) (620)
–––––––– ––––––––
Retained (loss)/profit for the Group and its share of joint ventures
and associated undertakings 20 (10,650) (133)
–––––––– ––––––––
Basic (loss)/earnings per share 7(15.89)p 1.80p
Diluted (loss)/earnings per share 7(15.90)p 1.78p
Adjusted basic earnings per share 73.75p 4.71p