Vodafone 2001 Annual Report Download - page 43
Download and view the complete annual report
Please find page 43 of the 2001 Vodafone annual report below. You can navigate through the pages in the report by either clicking on the pages listed below, or by using the keyword search tool below to find specific information within the annual report.-
 1
1 -
2
-
3
-
4
-
5
-
6
-
7
-
8
-
9
-
10
-
11
-
12
-
13
-
14
-
15
-
16
-
17
-
18
-
19
-
20
-
21
-
22
-
23
-
24
-
25
-
26
-
27
-
28
-
29
-
30
-
31
-
32
-
 33
33 -
 34
34 -
 35
35 -
 36
36 -
 37
37 -
 38
38 -
 39
39 -
 40
40 -
 41
41 -
 42
42 -
 43
43 -
 44
44 -
 45
45 -
 46
46 -
 47
47 -
 48
48 -
 49
49 -
 50
50 -
 51
51 -
 52
52 -
 53
53 -
54
-
55
-
56
-
57
-
58
-
59
-
60
-
61
-
62
-
63
-
64
-
65
-
66
-
67
-
68
 |
 |

Vodafone Group Plc
Annual Report & Accounts
for the year ended
31 March 2001
41
NOTES TO THE CONSOLIDATED FINANCIAL STATEMENTS continued
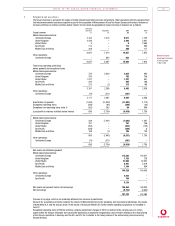
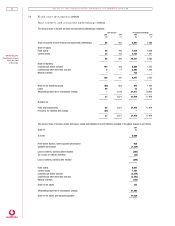
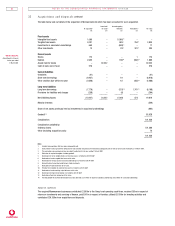
16 Fin an cial liabilities 2001 2000
£m £m
Net debt
Liquid investments (7,593) (30)
Cash at bank and in hand (68) (159)
Debt due in one year or less, or on demand 3,611 794
Debt due after one year 10,772 6,038
–––––––– ––––––––
6,722 6,643
–––––––– ––––––––
Maturity of finan cial liabilities
The maturity profile of the Group’s borrowings at 31 March was as follows:
In one year or less, or on demand 3,611 794
In more than one year but not more than two years 632 481
In more than two years but not more than five years 4,237 1,681
In more than five years 5,903 3,876
–––––––– ––––––––
14,383 6,832
–––––––– ––––––––
The maturities of the Group’s other financial liabilities at 31 March was as follows:
In more than one year but not more than two years 433
In more than two years but not more than five years 33
–––––––– ––––––––
736
–––––––– ––––––––
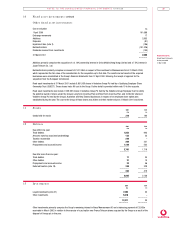
Borrowin g facilities
The Group had the following undrawn committed borrowing facilities available to it on 31 March:
Expiring in one year or less 10,234 5,689
Expiring in more than one year but not more than two years ––
Expiring in more than two years –4,562
–––––––– ––––––––
10,234 10,251
–––––––– ––––––––
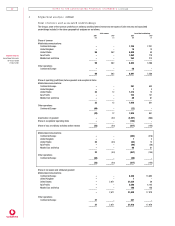
In addition to the above, certain of the Group’s subsidiaries had non-recourse committed facilities at 31 March 2001 of £1,005m in
aggregate, of which £322m was undrawn. Of the total committed facilities, £438m expires between two and five years, with the
remainder expiring in more than five years.
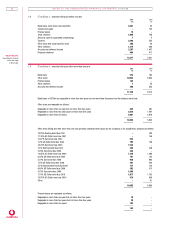
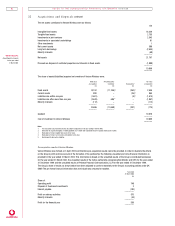
In terest rate an d curren cy of fin ancial liabilities
After taking into account the various interest rate and currency swaps entered into by the Group, the currency and interest rate
exposure of the financial liabilities of the Group was:
Fixed rate financial liabilities
Floating Fixed Non-interest Weighted Non-interest bearing
rate rate bearing Weighted average time financial liabilities –
financial financial financial average for which weighted average
Total liabilities liabilities liabilities interest rate rate is fixed period until maturity
Currency £m £m £m £m % Years Years
At 31 March 2001:
Sterling 1,994 1,496 498 – 7.7 1.8 –
Euro 5,819 1,076 4,743 – 5.1 5.8 –
US Dollar 5,368 567 4,801 – 7.5 8.7 –
Other 1,209 865 337 7 0.5 1.0 2.2
–––––––– –––––––– –––––––– –––––––– –––––––– –––––––– ––––––––
Gross financial liabilities 14,390 4,004 10,379 7 6.2 6.8 2.2
–––––––– –––––––– –––––––– –––––––– –––––––– –––––––– ––––––––
At 31 March 2000:
Sterling 2,298 871 1,422 5 6.7 1.6 0.7
Euro 1,895 322 1,511 62 3.8 1.6 1.3
US Dollar 2,057 578 1,479 – 7.3 13.1 –
Other 618 614 – 4 – – 3.2
–––––––– –––––––– –––––––– –––––––– –––––––– –––––––– ––––––––
Gross financial liabilities 6,868 2,385 4,412 71 5.9 5.5 1.4
–––––––– –––––––– –––––––– –––––––– –––––––– –––––––– ––––––––
Interest on floating rate borrowings is based on national LIBOR equivalents or government bond rates in the relevant currencies.