Vodafone 2001 Annual Report Download - page 40
Download and view the complete annual report
Please find page 40 of the 2001 Vodafone annual report below. You can navigate through the pages in the report by either clicking on the pages listed below, or by using the keyword search tool below to find specific information within the annual report.-
 1
1 -
2
-
3
-
4
-
5
-
6
-
7
-
8
-
9
-
10
-
11
-
12
-
13
-
14
-
15
-
16
-
17
-
18
-
19
-
20
-
21
-
22
-
23
-
24
-
25
-
26
-
27
-
28
-
29
-
 30
30 -
 31
31 -
 32
32 -
 33
33 -
 34
34 -
 35
35 -
 36
36 -
 37
37 -
 38
38 -
 39
39 -
 40
40 -
 41
41 -
 42
42 -
 43
43 -
 44
44 -
 45
45 -
 46
46 -
 47
47 -
 48
48 -
 49
49 -
 50
50 -
51
-
52
-
53
-
54
-
55
-
56
-
57
-
58
-
59
-
60
-
61
-
62
-
63
-
64
-
65
-
66
-
67
-
68
 |
 |

38
Vodafone Group Plc
Annual Report & Accounts
for the year ended
31 March 2001
NOTES TO THE CONSOLIDATED FINANCIAL STATEMENTS continued
10 Fixed asset in vestm en ts continued
Join t ven tures an d associated un dertakin gs continued
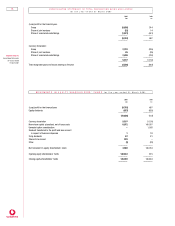
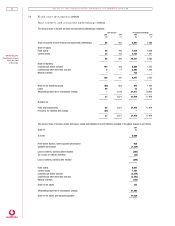
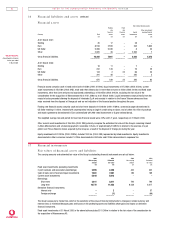
The Group’s share of its joint ventures and associated undertakings comprises:
Joint ventures Associated undertakings
2001 2000 2001 2000
£m £m £m £m
Share of turnover of joint ventures and associated undertakings 98 362 8,891 3,286
––––––– ––––––– ––––––– –––––––
Share of assets
Fixed assets 65 790 7,519 2,439
Current assets 23 103 3,232 1,341
––––––– ––––––– ––––––– –––––––
88 893 10,751 3,780
––––––– ––––––– ––––––– –––––––
Share of liabilities
Liabilities due within one year 144 164 5,889 1,737
Liabilities due after more than one year 277 3,865 1,020
Minority interests ––123 –
––––––– ––––––– ––––––– –––––––
146 241 9,877 2,757
––––––– ––––––– ––––––– –––––––
Share of net (liabilities)/assets (58) 652 874 1,023
Loans 85 –25 33
Attributed goodwill net of amortisation charges –2,019 31,011 16,923
––––––– ––––––– ––––––– –––––––
27 2,671 31,910 17,979
––––––– ––––––– ––––––– –––––––
Analysed as:
Fixed asset investments 85 2,671 31,910 17,979
Provisions for liabilities and charges (58) –––
––––––– ––––––– ––––––– –––––––
27 2,671 31,910 17,979
––––––– ––––––– ––––––– –––––––
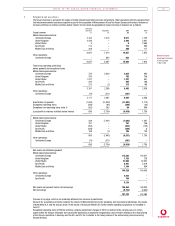
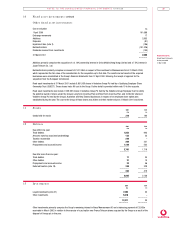
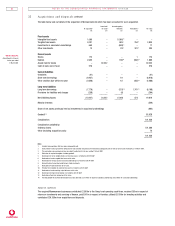
The Group’s share of turnover, profits and losses, assets and liabilities of Verizon Wireless included in the above analysis is as follows:
2001
Share of: £m
Turnover 5,000
–––––––
Profit before taxation, before goodwill amortisation 926
Goodwill amortisation (1,229)
–––––––
Loss on ordinary activities before taxation (303)
Tax on loss on ordinary activities (53)
–––––––
Loss on ordinary activities after taxation (356)
–––––––
Fixed assets 5,027
Current assets 1,342
Liabilities due within one year (3,529)
Liabilities due after more than one year (2,394)
Minority interests (123)
–––––––
Share of net assets 323
Attributed goodwill net of amortisation charges 21,205
–––––––
Share of net assets and attributed goodwill 21,528
–––––––