Vodafone 2001 Annual Report Download - page 23
Download and view the complete annual report
Please find page 23 of the 2001 Vodafone annual report below. You can navigate through the pages in the report by either clicking on the pages listed below, or by using the keyword search tool below to find specific information within the annual report.-
 1
1 -
2
-
3
-
4
-
5
-
6
-
7
-
8
-
9
-
10
-
11
-
12
-
 13
13 -
 14
14 -
 15
15 -
 16
16 -
 17
17 -
 18
18 -
 19
19 -
 20
20 -
 21
21 -
 22
22 -
 23
23 -
 24
24 -
 25
25 -
 26
26 -
 27
27 -
 28
28 -
 29
29 -
 30
30 -
 31
31 -
 32
32 -
 33
33 -
34
-
35
-
36
-
37
-
38
-
39
-
40
-
41
-
42
-
43
-
44
-
45
-
46
-
47
-
48
-
49
-
50
-
51
-
52
-
53
-
54
-
55
-
56
-
57
-
58
-
59
-
60
-
61
-
62
-
63
-
64
-
65
-
66
-
67
-
68
 |
 |

BOARD’S REPORT TO SHAREHOLDERS ON DIRECTORS’ REMUNERATION continued
Vodafone Group Plc
Annual Report & Accounts
for the year ended
31 March 2001
21
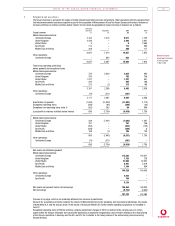
These options by exercise price were:
Options
held at Options Options Options Options
1 April 2000 granted exercised held at held at
Option or date of during during date of 31 March
price appointment the year the year resignation 2001
Pence Number Number Number Number Number
Vodafone Group Plc 1988 Executive Share Option Scheme (Approved)
Vodafone Group Plc 1988 Share Option Sche me (Unapproved)
Vodafone Group Plc 1998 Company Share Option Sche me (Approved)
Vodafone Group Plc 1998 Executive Share Option Scheme (Unapproved)
39.7 35,000 – 35,000 – –
46.7 110,500 – 110,500 – –
48.3 848,000 – 532,000 – 316,000
58.7 4,193,000 – 1,466,000 – 2,727,000
155.9 1,520,500 – – – 1,520,500
255.0 764,000 – – – 764,000
282.3 – 1,522,500 – – 1,522,500
Vodafone Group Plc 1988 Savings Re late d Share Option Schem e
Vodafone Group Plc 1998 Sharesave Sche me
37.2 18,540 – 18,540 – –
38.6 26,810 – – – 26,810
48.0 43,125 – – – 43,125
127.1 7,670 – – – 7,670
215.6 3,130 – – – 3,130
226.0 – 1,493 – – 1,493
AirTouch Communications, Inc. 1993 Long Term Stock Ince ntive P lan (1)
23.2 123,050 – 123,050 – –
36.8 31,350 – – 31,350 –
37.8 750,000 – 250,000 500,000 –
40.8 3,875,000 – – 3,875,000 –
41.8 29,850 – – 29,850 –
45.5 75,000 – 25,000 50,000 –
45.9 75,000 – 25,000 50,000 –
50.6 27,700 – – 27,700 –
52.2 29,150 – – 29,150 –
51.8 29,400 – – 29,400 –
52.6 53,000 – – 53,000 –
56.7 75,000 – 25,000 50,000 –
58.0 29,900 – – 29,900 –
60.4 25,750 – – 25,750 –
75.9 21,150 – – 21,150 –
89.1 18,350 – – 18,350 –
104.3 75,000 – 25,000 50,000 –
105.8 16,800 – – 16,800 –
108.8 20,000,000 – – 15,000,000 5,000,000
117.1 15,800 – – 15,800 –
136.1 10,700 – – 10,700 –
159.9 12,250 – – 12,250 –
232.5 8,000 – – 8,000 –
Vodafone Group 1999 Long Term Stock Ince ntive P lan
277.3 (1) 6,250,000 – – – 6,250,000
291.5 – 15,803,684 – – 15,803,684
––––––––– –––––––––– ––––––––– ––––––––––– –––––––––––
39,227,475 17,327,677 2,635,090 19,934,150 33,985,912
––––––––– –––––––––– ––––––––– ––––––––––– –––––––––––
Notes
1. Share options which take the form of American Depository Shares, each representing ten ordinary shares in the Company, which are traded on the New York Stock Exchange. The number and option price
have been converted into the equivalent amounts for the Company’s ordinary shares, with the option price being translated at the average exchange rate for the year of $1.48 : £1.
Options granted at market value under the executive scheme or the unapproved scheme may not be exercised unless, between the date of
grant and the date of first vesting (three years after the date of grant), there has been real growth in the consolidated adjusted earnings per share
of the Company and options granted at a discount to market value may not be exercised unless the growth in the consolidated adjusted earnings
per share of the Company, in the same period, exceeds the growth in the Index of Retail Prices by 2 per cent. Under the 1998 schemes, the
performance criteria are different and options will only be exerciseable if, over any period of three consecutive financial years following grant,
the Company achieves growth in consolidated adjusted earnings per share which exceeds growth in the Index for that period by an average of
3 per cent per annum.