Vodafone 2001 Annual Report Download - page 44
Download and view the complete annual report
Please find page 44 of the 2001 Vodafone annual report below. You can navigate through the pages in the report by either clicking on the pages listed below, or by using the keyword search tool below to find specific information within the annual report.-
 1
1 -
2
-
3
-
4
-
5
-
6
-
7
-
8
-
9
-
10
-
11
-
12
-
13
-
14
-
15
-
16
-
17
-
18
-
19
-
20
-
21
-
22
-
23
-
24
-
25
-
26
-
27
-
28
-
29
-
30
-
31
-
32
-
33
-
 34
34 -
 35
35 -
 36
36 -
 37
37 -
 38
38 -
 39
39 -
 40
40 -
 41
41 -
 42
42 -
 43
43 -
 44
44 -
 45
45 -
 46
46 -
 47
47 -
 48
48 -
 49
49 -
 50
50 -
 51
51 -
 52
52 -
 53
53 -
 54
54 -
55
-
56
-
57
-
58
-
59
-
60
-
61
-
62
-
63
-
64
-
65
-
66
-
67
-
68
 |
 |

42 NOTES TO THE CONSOLIDATED FINANCIAL STATEMENTS continued
Vodafone Group Plc
Annual Report & Accounts
for the year ended
31 March 2001
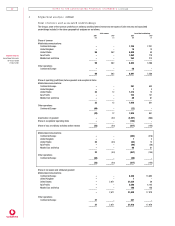
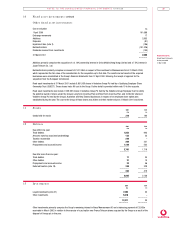
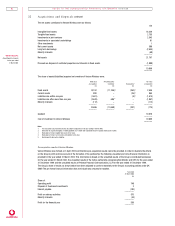
16 Fin an cial liabilities an d assets continued
Fin an cial assets
Non-interest bearing assets
Floating Fixed
rate rate Other non-interest
financial financial Equity bearing financial
Currency Total assets assets investments assets
£m £m £m £m £m
At 31 March 2001:
Sterling 45 17 – 28 –
Euro 8,518 2,559 – 334 5,643
US Dollar 5,098 5,049 – 8 23
Other 2,605 36 – 2,562 7
–––––––– –––––––– –––––––– –––––––– ––––––––
Gross financial liabilities 16,266 7,661 – 2,932 5,673
–––––––– –––––––– –––––––– –––––––– ––––––––
At 31 March 2000:
Sterling 18 11 – 7 –
Euro 232 128 – 79 25
US Dollar 134 2 32 66 34
Other 291 48 – 240 3
–––––––– –––––––– –––––––– –––––––– ––––––––
Gross financial liabilities 675 189 32 392 62
–––––––– –––––––– –––––––– –––––––– ––––––––
Financial assets comprise cash in hand and at bank of £68m (2000: £159m), liquid investments of £7,593m (2000: £30m), current
asset investments of £5,618m (2000: £Nil), trade and other debtors due in more than one year of £32m (2000: £44m) and fixed asset
investments, other than joint ventures and associated undertakings, of £2,955m (2000: £442m, excluding the fair value of the
consideration for the acquisition of Mannesmann AG of £101,246m as at 31 March 2000). Liquid investments arose primarily from the
receipt of sales proceeds following the disposal of Infostrada S.p.A and receipts in relation to the France Telecom shares and loan
notes received from the disposal of Orange plc and are not indicative of the financial position throughout the year.
Floating rate financial assets comprise cash and short term deposits of £4,484m (2000: £189m), commercial paper denominated in
US Dollar totalling £1,162m, invested with counterparties having a single-A credit rating or above, and a further £2,015m of purchase
and resale agreements denominated in Euro collateralised with AAA-rated Government or Supra-national bonds.
The weighted average rate and period for fixed rate financial assets were 4.9% and 3.7 years, respectively, at 31 March 2000.
Other current asset investments of £5,618m (2000: £Nil) primarily comprise the estimated fair value of the Group’s remaining interest
in Atecs Mannesmann and a balancing payment, receivable in Euros, of approximately £3,092m in relation to the exercise of a put
option over France Telecom shares acquired by the Group as a result of the disposal of Orange plc during the year.
Equity investments of £2,932m (2000: £392m) include £2,510m (2000: £Nil) represented by listed investments. Equity investments
denominated in other currencies include £1,759m denominated in HK Dollar and £704m denominated in Japanese Yen.
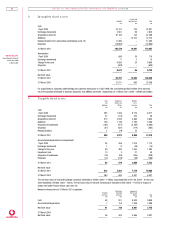
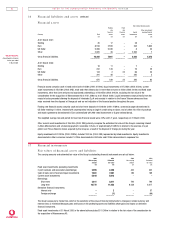
17 Fin an cial in stru m ents
Fair values of fin ancial assets an d liabilities
The carrying amounts and estimated fair value of the Group’s outstanding financial instruments are set out below:
2001 2001 2000 2000
Net carrying Estimated Net carrying Estimated
amount fair value amount fair value
£m £m £m £m
Fixed asset investments (excluding investments
in joint ventures and associated undertakings) 2,955 2,350 442 442
Cash at bank and in hand and liquid investments 7,661 7,661 189 189
Current asset investments 5,618 5,618 ––
Borrowings:
Short term 3,611 3,611 794 794
Long term 10,772 11,058 6,038 6,017
Derivative financial instruments:
Interest rate –2 –57
Foreign exchange – (1) – (66)
––––––– ––––––– ––––––– –––––––
The Group’s exposure to market risk, which is the sensitivity of the value of financial instruments to changes in related currency and
interest rates, is minimised because gains and losses on the underlying assets and liabilities offset gains and losses on derivative
financial instruments.
Fixed asset investments at 31 March 2000 in the above table excludes £101,246m in relation to the fair value of the consideration for
the acquisition of Mannesmann AG.