Vodafone 2001 Annual Report Download - page 34
Download and view the complete annual report
Please find page 34 of the 2001 Vodafone annual report below. You can navigate through the pages in the report by either clicking on the pages listed below, or by using the keyword search tool below to find specific information within the annual report.-
 1
1 -
2
-
3
-
4
-
5
-
6
-
7
-
8
-
9
-
10
-
11
-
12
-
13
-
14
-
15
-
16
-
17
-
18
-
19
-
20
-
21
-
22
-
23
-
 24
24 -
 25
25 -
 26
26 -
 27
27 -
 28
28 -
 29
29 -
 30
30 -
 31
31 -
 32
32 -
 33
33 -
 34
34 -
 35
35 -
 36
36 -
 37
37 -
 38
38 -
 39
39 -
 40
40 -
 41
41 -
 42
42 -
 43
43 -
 44
44 -
45
-
46
-
47
-
48
-
49
-
50
-
51
-
52
-
53
-
54
-
55
-
56
-
57
-
58
-
59
-
60
-
61
-
62
-
63
-
64
-
65
-
66
-
67
-
68
 |
 |

32
Vodafone Group Plc
Annual Report & Accounts
for the year ended
31 March 2001
NOTES TO THE CONSOLIDATED FINANCIAL STATEMENTS continued
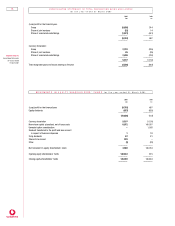
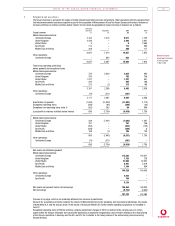
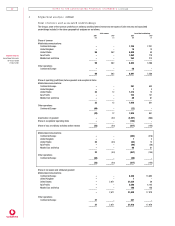
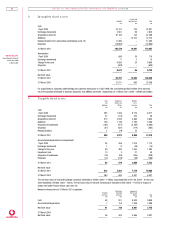
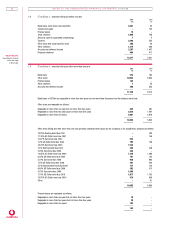
1 Segm ental an alysis continued
Join t ven tures an d associated un dertakin gs
The Group’s share of the turnover, profit/loss on ordinary activities before interest and net assets of joint ventures and associated
undertakings included in the above geographical analyses are as follows:
Joint ventures Associated undertakings
2001 2000 2001 2000
£m £m £m £m
Share of turnover
Mobile telecommunications:
Continental Europe ––1,704 2,231
United Kingdom ––14 13
United States 98 362 5,000 50
Asia Pacific ––1,862 779
Middle East and Africa ––263 213
––––––– ––––––– ––––––– –––––––
98 362 8,843 3,286
Other operations:
Continental Europe ––48 –
––––––– ––––––– ––––––– –––––––
98 362 8,891 3,286
––––––– ––––––– ––––––– –––––––
Share of operating profit/(loss) before goodwill and exceptional items
Mobile telecommunications:
Continental Europe ––391 603
United Kingdom ––13
United States 22 12 1,313 13
Asia Pacific ––152 141
Middle East and Africa ––89 81
––––––– ––––––– ––––––– –––––––
22 12 1,946 841
Other operations:
Continental Europe (64) –(22) –
––––––– ––––––– ––––––– –––––––
(42) 12 1,924 841
Amortisation of goodwill –(52) (2,297) (986)
Share of exceptional operating items ––(144) –
––––––– ––––––– ––––––– –––––––
Share of loss on ordinary activities before interest (42) (40) (517) (145)
––––––– ––––––– ––––––– –––––––
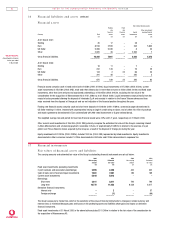
Mobile telecommunications:
Continental Europe ––(383) (216)
United Kingdom ––13
United States 22 (40) (62) 13
Asia Pacific ––(99) (26)
Middle East and Africa ––86 81
––––––– ––––––– ––––––– –––––––
22 (40) (457) (145)
Other operations:
Continental Europe (64) –(60) –
––––––– ––––––– ––––––– –––––––
(42) (40) (517) (145)
––––––– ––––––– ––––––– –––––––
Share of net assets and attributed goodwill
Mobile telecommunications:
Continental Europe ––6,306 13,690
United Kingdom ––1–
United States –2,671 21,534 39
Asia Pacific ––3,580 4,142
Middle East and Africa ––188 108
––––––– ––––––– ––––––– –––––––
–2,671 31,609 17,979
Other operations:
Continental Europe 27 –301 –
––––––– ––––––– ––––––– –––––––
27 2,671 31,910 17,979
––––––– ––––––– ––––––– –––––––