Vodafone 2001 Annual Report Download - page 37
Download and view the complete annual report
Please find page 37 of the 2001 Vodafone annual report below. You can navigate through the pages in the report by either clicking on the pages listed below, or by using the keyword search tool below to find specific information within the annual report.-
 1
1 -
2
-
3
-
4
-
5
-
6
-
7
-
8
-
9
-
10
-
11
-
12
-
13
-
14
-
15
-
16
-
17
-
18
-
19
-
20
-
21
-
22
-
23
-
24
-
25
-
26
-
 27
27 -
 28
28 -
 29
29 -
 30
30 -
 31
31 -
 32
32 -
 33
33 -
 34
34 -
 35
35 -
 36
36 -
 37
37 -
 38
38 -
 39
39 -
 40
40 -
 41
41 -
 42
42 -
 43
43 -
 44
44 -
 45
45 -
 46
46 -
 47
47 -
48
-
49
-
50
-
51
-
52
-
53
-
54
-
55
-
56
-
57
-
58
-
59
-
60
-
61
-
62
-
63
-
64
-
65
-
66
-
67
-
68
 |
 |

Vodafone Group Plc
Annual Report & Accounts
for the year ended
31 March 2001
35
NOTES TO THE CONSOLIDATED FINANCIAL STATEMENTS continued
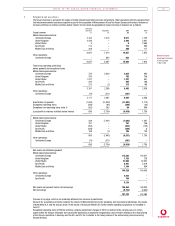
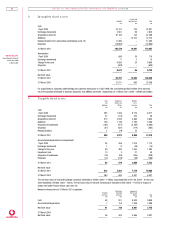
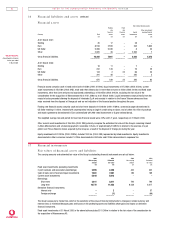
5 Tax on (loss)/profit on ordin ary activities 2001 2000
£m £m
United Kingdom
Corporation tax charge at 30% (2000 – 30%) 217 117
Transfer (from)/to deferred taxation (35) 11
–––––––– ––––––––
182 128
–––––––– ––––––––
International
Current tax – Current year 841 691
Current tax – Prior year (48) –
Transfer to/(from) deferred taxation 280 (134)
Tax on exceptional non-operating items 35 –
–––––––– ––––––––
1,108 557
–––––––– ––––––––
1,290 685
–––––––– ––––––––
Parent and subsidiary undertakings 1,118 494
Share of joint ventures (12) (57)
Share of associated undertakings 184 248
–––––––– ––––––––
1,290 685
–––––––– –––––––
The tax on exceptional non-operating items of £35m (2000 – £Nil) is in respect of the profit on termination of a hedging instrument in
March 2001 (see note 3).
The increase in the effective tax rate for the year ended 31 March 2001 is primarily the result of the integration of the Mannesmann
businesses into the Group’s results.
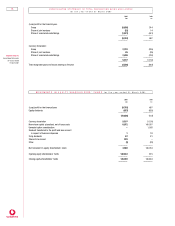
6 Equity dividen ds
2001 2000
£m £m
Interim dividend paid of 0.688p (2000 – 0.655p) per ordinary share 423 203
Proposed final dividend of 0.714p (2000 – 0.680p) per ordinary share 464 417
–––––––– ––––––––
887 620
–––––––– ––––––––
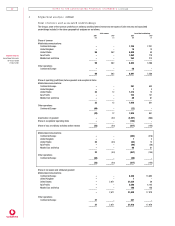
7 Earn in gs p er share
Weighted average number of shares (millions) in issue during
the year and used to calculate:
2001 2000
Basic and adjusted basic earnings per share 61,439 27,100
Dilutive effect of share options (41) 260
–––––––– ––––––––
Diluted earnings per share 61,398 27,360
–––––––– ––––––––
2001 Pence 2000 Pence
£m per share £m per share
(Loss)/earnings for basic (loss)/earnings per share (9,763) (15.89) 487 1.80
Goodwill amortisation 11,882 19.34 1,712 6.32
Exceptional operating items, net of attributable taxation 230 0.37 19 0.07
Exceptional non-operating items, net of attributable taxation (45) (0.07) (954) (3.52)
Exceptional finance costs, net of attributable taxation ––12 0.04
–––––––– –––––––– –––––––– ––––––––
Adjusted basic earnings per share 2,304 3.75 1,276 4.71
–––––––– –––––––– –––––––– ––––––––
(Loss)/earnings for basic (loss)/earnings per share represents the net (loss)/profit attributable to ordinary shareholders, being the
(loss)/profit on ordinary activities after taxation and minority interests, and has also been used to calculate diluted earnings per share.
Adjusted basic earnings per share has been presented in order to highlight the underlying performance of the Group.