Vodafone 2001 Annual Report Download - page 33
Download and view the complete annual report
Please find page 33 of the 2001 Vodafone annual report below. You can navigate through the pages in the report by either clicking on the pages listed below, or by using the keyword search tool below to find specific information within the annual report.-
 1
1 -
2
-
3
-
4
-
5
-
6
-
7
-
8
-
9
-
10
-
11
-
12
-
13
-
14
-
15
-
16
-
17
-
18
-
19
-
20
-
21
-
22
-
 23
23 -
 24
24 -
 25
25 -
 26
26 -
 27
27 -
 28
28 -
 29
29 -
 30
30 -
 31
31 -
 32
32 -
 33
33 -
 34
34 -
 35
35 -
 36
36 -
 37
37 -
 38
38 -
 39
39 -
 40
40 -
 41
41 -
 42
42 -
 43
43 -
44
-
45
-
46
-
47
-
48
-
49
-
50
-
51
-
52
-
53
-
54
-
55
-
56
-
57
-
58
-
59
-
60
-
61
-
62
-
63
-
64
-
65
-
66
-
67
-
68
 |
 |

Vodafone Group Plc
Annual Report & Accounts
for the year ended
31 March 2001
31
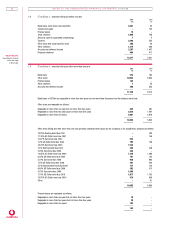
NOTES TO THE CONSOLIDATED FINANCIAL STATEMENTS
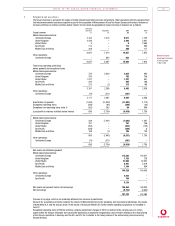
1 Segm ental an alysis
The Group’s business is principally the supply of mobile telecommunications services and products. Other operations primarily comprise fixed
line telecommunications businesses acquired as part of the acquisition of Mannesmann AG and the Vizzavi Europe joint venture. Analyses of
turnover, profit/loss on ordinary activities before interest and net assets by geographical region and class of business are as follows:
Continuing
operations Acquisitions 2001 2000
Group turnover £m £m £m £m
Mobile telecommunications:
Continental Europe 2,163 7,414 9,577 1,705
United Kingdom 3,444 – 3,444 2,901
United States 9 – 92,585
Asia Pacific 713 – 713 565
Middle East and Africa 308 – 308 117
–––––––– –––––––– –––––––– ––––––––
6,637 7,414 14,051 7,873
Other operations:
Continental Europe – 953 953 –
–––––––– –––––––– –––––––– ––––––––
6,637 8,367 15,004 7,873
–––––––– –––––––– –––––––– ––––––––
Total Group operating profit/(loss)
before goodwill and exceptional items
Mobile telecommunications:
Continental Europe 735 2,300 3,035 955
United Kingdom 795 – 795 706
United States 1,237 – 1,237 541
Asia Pacific 205 – 205 188
Middle East and Africa 215 (2) 213 148
–––––––– –––––––– –––––––– ––––––––
3,187 2,298 5,485 2,538
Other operations:
Continental Europe (70) (211) (281) –
–––––––– –––––––– –––––––– ––––––––
3,117 2,087 5,204 2,538
Amortisation of goodwill (1,843) (10,039) (11,882) (1,712)
Exceptional operating items (256) (64) (320) (30)
Exceptional non-operating items (note 3) (182) 262 80 954
–––––––– –––––––– –––––––– ––––––––
(Loss)/profit on ordinary activities before interest 836 (7,754) (6,918) 1,750
–––––––– –––––––– –––––––– ––––––––
Mobile telecommunications:
Continental Europe 439 (7,441) (7,002) 1,007
United Kingdom 757 – 757 706
United States (252) – (252) (100)
Asia Pacific (226) – (226) 8
Middle East and Africa 188 (2) 186 129
–––––––– –––––––– –––––––– ––––––––
906 (7,443) (6,537) 1,750
Other operations:
Continental Europe (70) (311) (381) –
–––––––– –––––––– –––––––– ––––––––
836 (7,754) (6,918) 1,750
–––––––– –––––––– –––––––– ––––––––
Net assets and attributed goodwill
Mobile telecommunications:
Continental Europe 113,584 118,577
United Kingdom 7,155 729
United States 21,084 23,547
Asia Pacific 6,401 5,216
Middle East and Africa 1,104 934
–––––––– ––––––––
149,328 149,003
Other operations:
Continental Europe 4,432 –
Asia Pacific 704 –
–––––––– ––––––––
5,136 –
Net assets and goodwill, before net borrowings 154,464 149,003
Net borrowings (6,722) (6,643)
–––––––– ––––––––
147,742 142,360
–––––––– ––––––––
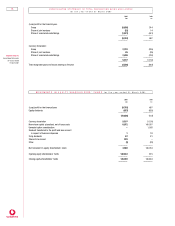
Turnover is by origin, which is not materially different from turnover by destination.
Amounts for acquisitions primarily comprise the results of Mannesmann AG and its subsidiary and associated undertakings, the results
of Airtel Móvil S.A. and the Group’s share of the results of Swisscom Mobile SA. Further details regarding acquisitions are included in
note 22.
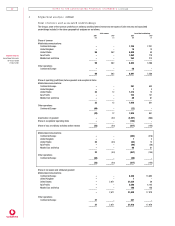
Exceptional operating items of £320m primarily comprise impairment charges of £91m in relation to the carrying value of certain
assets within the Group’s Globalstar service provider businesses, exceptional reorganisation costs of £85m relating to the restructuring
of the Group’s operations in Germany and the US, and £141m in relation to the Group’s share of the restructuring costs incurred by
Verizon Wireless.