US Cellular 2012 Annual Report Download - page 76
Download and view the complete annual report
Please find page 76 of the 2012 US Cellular annual report below. You can navigate through the pages in the report by either clicking on the pages listed below, or by using the keyword search tool below to find specific information within the annual report.-
 1
1 -
2
-
3
-
4
-
5
-
6
-
7
-
8
-
9
-
10
-
11
-
12
-
13
-
14
-
15
-
16
-
17
-
18
-
19
-
20
-
21
-
22
-
23
-
24
-
25
-
26
-
27
-
28
-
29
-
30
-
31
-
32
-
33
-
34
-
35
-
36
-
37
-
38
-
39
-
40
-
41
-
42
-
43
-
44
-
45
-
46
-
47
-
48
-
49
-
50
-
51
-
52
-
53
-
54
-
55
-
56
-
57
-
58
-
59
-
60
-
61
-
62
-
63
-
64
-
65
-
 66
66 -
 67
67 -
 68
68 -
 69
69 -
 70
70 -
 71
71 -
 72
72 -
 73
73 -
 74
74 -
 75
75 -
 76
76 -
 77
77 -
 78
78 -
 79
79 -
 80
80 -
 81
81 -
 82
82 -
 83
83 -
 84
84 -
 85
85 -
 86
86 -
87
-
88
-
89
-
90
-
91
-
92
 |
 |

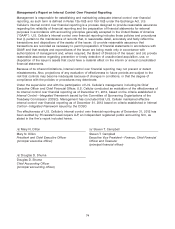
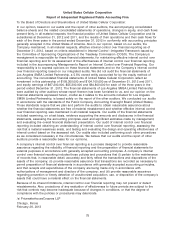
United States Cellular Corporation
Notes to the Consolidated Financial Statements (Continued)
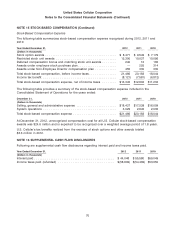
NOTE 15 STOCK-BASED COMPENSATION (Continued)
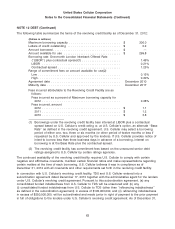
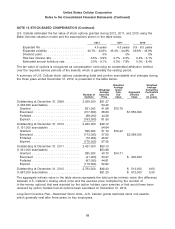
U.S. Cellular estimated the fair value of stock options granted during 2012, 2011, and 2010 using the
Black-Scholes valuation model and the assumptions shown in the table below.
2012 2011 2010
Expected life ........................ 4.5 years 4.3 years 0.9 - 8.0 years
Expected volatility .................... 40.7% - 42.6% 43.4% - 44.8% 26.9% - 43.9%
Dividend yield ....................... 0% 0% 0%
Risk-free interest rate .................. 0.5% - 0.9% 0.7% - 2.0% 0.4% - 3.1%
Estimated annual forfeiture rate .......... 0.0% - 9.1% 0.0% - 7.8% 0.0% - 8.4%
The fair value of options is recognized as compensation cost using an accelerated attribution method
over the requisite service periods of the awards, which is generally the vesting period.
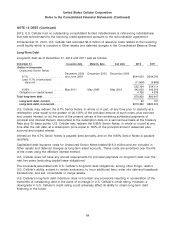
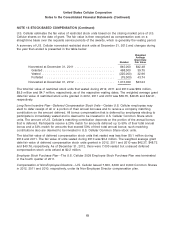
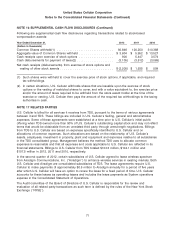
A summary of U.S. Cellular stock options outstanding (total and portion exercisable) and changes during
the three years ended December 31, 2012, is presented in the table below:
Weighted Weighted
Average Average
Weighted Grant Remaining
Average Date Aggregate Contractual
Number of Exercise Fair Intrinsic Life
Options Price Value Value (in years)
Outstanding at December 31, 2009 ........ 2,029,000 $51.37
(1,046,000 exercisable) ................. 54.40
Granted .......................... 831,000 41.98 $13.75
Exercised ......................... (317,000) 38.60 $1,555,000
Forfeited .......................... (88,000) 44.28
Expired ........................... (193,000) 61.50
Outstanding at December 31, 2010 ........ 2,262,000 $49.12
(1,151,000 exercisable) ................. 54.64
Granted .......................... 595,000 51.70 $19.42
Exercised ......................... (173,000) 37.50 $2,099,000
Forfeited .......................... (72,000) 45.97
Expired ........................... (175,000) 57.05
Outstanding at December 31, 2011 ........ 2,437,000 $50.10
(1,321,000 exercisable) ................. $53.68
Granted .......................... 580,000 40.70 $14.71
Exercised ......................... (41,000) 34.27 $ 205,000
Forfeited .......................... (97,000) 44.81
Expired ........................... (116,000) 52.92
Outstanding at December 31, 2012 ........ 2,763,000 $48.43 $ 513,000 6.60
(1,657,000 exercisable) ................. $51.20 $ 513,000 5.30
The aggregate intrinsic value in the table above represents the total pre-tax intrinsic value (the difference
between U.S. Cellular’s closing stock price and the exercise price multiplied by the number of
in-the-money options) that was received by the option holders upon exercise or that would have been
received by option holders had all options been exercised on December 31, 2012.
Long-Term Incentive Plan—Restricted Stock Units—U.S. Cellular grants restricted stock unit awards,
which generally vest after three years, to key employees.
68