US Cellular 2012 Annual Report Download - page 32
Download and view the complete annual report
Please find page 32 of the 2012 US Cellular annual report below. You can navigate through the pages in the report by either clicking on the pages listed below, or by using the keyword search tool below to find specific information within the annual report.-
 1
1 -
2
-
3
-
4
-
5
-
6
-
7
-
8
-
9
-
10
-
11
-
12
-
13
-
14
-
15
-
16
-
17
-
18
-
19
-
20
-
21
-
 22
22 -
 23
23 -
 24
24 -
 25
25 -
 26
26 -
 27
27 -
 28
28 -
 29
29 -
 30
30 -
 31
31 -
 32
32 -
 33
33 -
 34
34 -
 35
35 -
 36
36 -
 37
37 -
 38
38 -
 39
39 -
 40
40 -
 41
41 -
 42
42 -
43
-
44
-
45
-
46
-
47
-
48
-
49
-
50
-
51
-
52
-
53
-
54
-
55
-
56
-
57
-
58
-
59
-
60
-
61
-
62
-
63
-
64
-
65
-
66
-
67
-
68
-
69
-
70
-
71
-
72
-
73
-
74
-
75
-
76
-
77
-
78
-
79
-
80
-
81
-
82
-
83
-
84
-
85
-
86
-
87
-
88
-
89
-
90
-
91
-
92
 |
 |

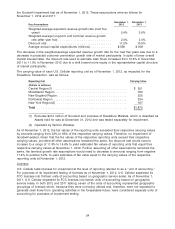
the Goodwill impairment test as of November 1, 2012. These assumptions were as follows for
November 1, 2012 and 2011:
November 1, November 1,
Key Assumptions 2012 2011
Weighted-average expected revenue growth rate (next five
years) ...................................... 2.4% 3.6%
Weighted-average long-term and terminal revenue growth
rate (after year five) ............................. 2.0% 2.0%
Discount rate ................................... 11.0% 10.5%
Average annual capital expenditures (millions) ........... $559 $609
The decrease in the weighted-average expected revenue growth rate for the next five years was due to a
decrease in projected customer penetration growth rate of market participants. In spite of lower overall
market interest rates, the discount rate used to estimate cash flows increased from 10.5% in November
2011 to 11.0% in November 2012 due to a shift toward more equity in the representative capital structure
of market participants.
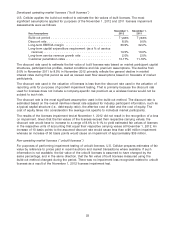
The carrying value of each U.S. Cellular reporting unit as of November 1, 2012, as impacted for the
Divestiture Transaction, was as follows:
Reporting Unit Carrying Value
(Dollars in millions)
Central Region(1) ........................................ $ 351
Mid-Atlantic Region ....................................... 763
New England Region ...................................... 255
Northwest Region ........................................ 334
New York Region(2) ...................................... 167
Total ................................................. $1,870
(1) Excludes $214 million of Goodwill and Licenses of Divestiture Markets, which is classified as
Assets held for sale at December 31, 2012 and was tested separately for impairment.
(2) Operated by Verizon Wireless.
As of November 1, 2012, the fair values of the reporting units exceeded their respective carrying values
by amounts ranging from 23% to 63% of the respective carrying values. Therefore, no impairment of
Goodwill existed. Given that the fair values of the respective reporting units exceed their respective
carrying values, provided all other assumptions remained the same, the discount rate would have to
increase to a range of 11.8% to 14.6% to yield estimated fair values of reporting units that equal their
respective carrying values at November 1, 2012. Further, assuming all other assumptions remained the
same, the terminal growth rate assumptions would need to decrease to amounts ranging from negative
11.2% to positive 0.2%, to yield estimates of fair value equal to the carrying values of the respective
reporting units at November 1, 2012.
Licenses
U.S. Cellular tests licenses for impairment at the level of reporting referred to as a ‘‘unit of accounting.’’
For purposes of its impairment testing of licenses as of November 1, 2012, U.S. Cellular separated its
FCC licenses into thirteen units of accounting based on geographic service areas. As of November 1,
2011, U.S. Cellular separated its FCC licenses into twelve units of accounting based on geographic
service areas. In both 2012 and 2011 testing, seven of the units of accounting represented geographic
groupings of licenses which, because they were not being utilized and, therefore, were not expected to
generate cash flows from operating activities in the foreseeable future, were considered separate units of
accounting for purposes of impairment testing.
24