US Cellular 2012 Annual Report Download - page 24
Download and view the complete annual report
Please find page 24 of the 2012 US Cellular annual report below. You can navigate through the pages in the report by either clicking on the pages listed below, or by using the keyword search tool below to find specific information within the annual report.-
 1
1 -
2
-
3
-
4
-
5
-
6
-
7
-
8
-
9
-
10
-
11
-
12
-
13
-
 14
14 -
 15
15 -
 16
16 -
 17
17 -
 18
18 -
 19
19 -
 20
20 -
 21
21 -
 22
22 -
 23
23 -
 24
24 -
 25
25 -
 26
26 -
 27
27 -
 28
28 -
 29
29 -
 30
30 -
 31
31 -
 32
32 -
 33
33 -
 34
34 -
35
-
36
-
37
-
38
-
39
-
40
-
41
-
42
-
43
-
44
-
45
-
46
-
47
-
48
-
49
-
50
-
51
-
52
-
53
-
54
-
55
-
56
-
57
-
58
-
59
-
60
-
61
-
62
-
63
-
64
-
65
-
66
-
67
-
68
-
69
-
70
-
71
-
72
-
73
-
74
-
75
-
76
-
77
-
78
-
79
-
80
-
81
-
82
-
83
-
84
-
85
-
86
-
87
-
88
-
89
-
90
-
91
-
92
 |
 |

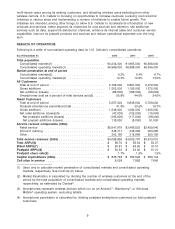
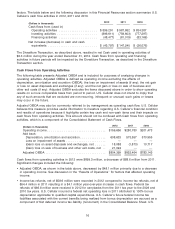
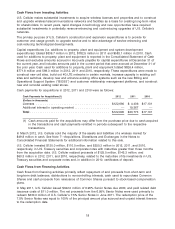
factors. The table below and the following discussion in this Financial Resources section summarize U.S.
Cellular’s cash flow activities in 2012, 2011 and 2010.
2012 2011 2010
(Dollars in thousands)
Cash flows from (used in)
Operating activities ..................... $899,291 $ 987,862 $ 834,387
Investing activities ...................... (896,611) (759,603) (777,297)
Financing activities ..................... (48,477) (81,019) (83,166)
Net increase (decrease) in cash and cash
equivalents ........................... $ (45,797) $ 147,240 $ (26,076)
The Divestiture Transaction, as described above, resulted in net Cash used in operating activities of
$0.3 million during the year ended December 31, 2012. Cash flows from operating and financing
activities in future periods will be impacted by the Divestiture Transaction, as described in the Divestiture
Transaction section.
Cash Flows from Operating Activities
The following table presents Adjusted OIBDA and is included for purposes of analyzing changes in
operating activities. Adjusted OIBDA is defined as operating income excluding the effects of:
depreciation, amortization and accretion (OIBDA); the loss on impairment of assets (if any); the net gain
or loss on asset disposals and exchanges (if any); and the net gain or loss on sale of business and
other exit costs (if any). Adjusted OIBDA excludes the items discussed above in order to show operating
results on a more comparable basis from period to period. U.S. Cellular does not intend to imply that
any of such amounts that are excluded are non-recurring, infrequent or unusual; such gains or losses
may occur in the future.
Adjusted OIBDA may also be commonly referred to by management as operating cash flow. U.S. Cellular
believes this measure provides useful information to investors regarding U.S. Cellular’s financial condition
and results of operations because it highlights certain key cash and non-cash items and their impacts on
cash flows from operating activities. This amount should not be confused with Cash flows from operating
activities, which is a component of the Consolidated Statement of Cash Flows.
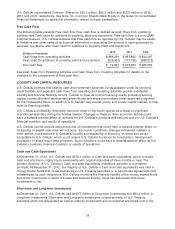
2012 2011 2010
(Dollars in thousands)
Operating income ................................ $156,656 $280,780 $201,473
Add back:
Depreciation, amortization and accretion .............. 608,633 573,557 570,955
Loss on impairment of assets ......................———
(Gain) loss on asset disposals and exchanges, net ...... 18,088 (1,873) 10,717
(Gain) loss on sale of business and other exit costs, net . . 21,022 — —
Adjusted OIBDA ................................. $804,399 $852,464 $783,145
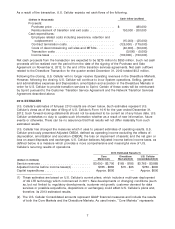
Cash flows from operating activities in 2012 were $899.3 million, a decrease of $88.6 million from 2011.
Significant changes included the following:
• Adjusted OIBDA, as shown in the table above, decreased by $48.1 million primarily due to a decrease
in operating income. See discussion in the ‘‘Results of Operations’’ for factors that affected operating
income.
• Income tax refunds, net of $58.6 million were recorded in 2012 compared to income tax refunds, net of
$54.4 million in 2011 resulting in a $4.1 million year-over-year increase in cash flows. Federal tax
refunds of $66.8 million were received in 2012 for carrybacks from the 2011 tax year to the 2009 and
2010 tax years. U.S. Cellular incurred a federal net operating loss in 2011 attributed to 100% bonus
depreciation applicable to qualified capital expenditures. U.S. Cellular’s future federal income tax
liabilities associated with the current benefits being realized from bonus depreciation are accrued as a
component of Net deferred income tax liability (noncurrent) in the Consolidated Balance Sheet. U.S.
16