US Cellular 2012 Annual Report Download - page 21
Download and view the complete annual report
Please find page 21 of the 2012 US Cellular annual report below. You can navigate through the pages in the report by either clicking on the pages listed below, or by using the keyword search tool below to find specific information within the annual report.-
 1
1 -
2
-
3
-
4
-
5
-
6
-
7
-
8
-
9
-
10
-
 11
11 -
 12
12 -
 13
13 -
 14
14 -
 15
15 -
 16
16 -
 17
17 -
 18
18 -
 19
19 -
 20
20 -
 21
21 -
 22
22 -
 23
23 -
 24
24 -
 25
25 -
 26
26 -
 27
27 -
 28
28 -
 29
29 -
 30
30 -
 31
31 -
32
-
33
-
34
-
35
-
36
-
37
-
38
-
39
-
40
-
41
-
42
-
43
-
44
-
45
-
46
-
47
-
48
-
49
-
50
-
51
-
52
-
53
-
54
-
55
-
56
-
57
-
58
-
59
-
60
-
61
-
62
-
63
-
64
-
65
-
66
-
67
-
68
-
69
-
70
-
71
-
72
-
73
-
74
-
75
-
76
-
77
-
78
-
79
-
80
-
81
-
82
-
83
-
84
-
85
-
86
-
87
-
88
-
89
-
90
-
91
-
92
 |
 |
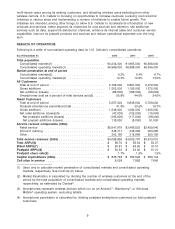
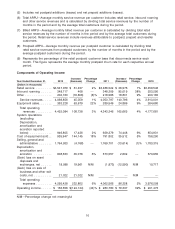
• Customer usage expenses increased by $4.1 million, or 1%, in 2012, and $2.7 million, or 1%, in 2011,
primarily due to an increase in data capacity and usage, offset by a decline in voice usage in both
years as well as reduced intercarrier compensation expenses as a result of the FCC’s Reform Order.
• Expenses incurred when U.S. Cellular’s customers used other carriers’ networks while roaming
decreased $11.1 million, or 4%, in 2012 and increased $45.4 million, or 22%, in 2011. In 2012 roaming
data usage continued to increase rapidly but it was more than offset by reductions in negotiated
roaming rates and continued decreases in voice roaming. The increase in 2011 was primarily due to
increased data roaming usage partially offset by a decline in voice roaming expenses.
U.S. Cellular expects system operations expenses to increase in the future to support the continued
growth in cell sites and other network facilities as it continues to add capacity, enhance quality and
deploy new technologies as well as to support increases in total customer usage, particularly data
usage. However, these increases are expected to be offset to some extent by cost savings generated by
shifting data traffic to the 4G LTE network from the 3G network, containment of roaming expense via
lower negotiated rates and initiatives designed to reduce overall customer usage.
Cost of equipment sold
Cost of equipment sold increased $144.1 million, or 18%, in 2012 and $35.5 million, or 5% in 2011. In
2012, total devices sold increased by 1% due to expanded distribution for U Prepaid compared to a
decline in total wireless devices sold in 2011. In both years there was an increase in the average cost
per wireless device sold (18% in 2012 and 8% in 2011) due to a shift in the mix of sales to smartphones.
In 2012, the introduction of 4G LTE devices also was a significant driver to the increase in Cost of
equipment sold as these devices are more costly than similar 3G devices. However, 4G LTE technology
results in lower system operations expense during a customer’s lifecycle.
U.S. Cellular’s loss on equipment, defined as equipment sales revenues less cost of equipment sold,
was $582.7 million, $502.3 million and $491.6 million for 2012, 2011 and 2010, respectively. U.S. Cellular
expects loss on equipment to continue to be a significant cost in the foreseeable future as wireless
carriers continue to use device availability and pricing as a means of competitive differentiation. In
addition, U.S. Cellular expects increasing sales of data centric wireless devices such as smartphones
and tablets to result in higher equipment subsidies over time; these devices generally have higher
purchase costs which cannot be recovered through proportionately higher selling prices to customers.
Smartphones sold as a percentage of total devices sold was 56%, 44% and 25% in 2012, 2011 and
2010, respectively.
Selling, general and administrative expenses
Selling, general and administrative expenses include salaries, commissions and expenses of field sales
and retail personnel and facilities; telesales department salaries and expenses; agent commissions and
related expenses; corporate marketing and merchandise management; and advertising expenses.
Selling, general and administrative expenses also include bad debts expense, costs of operating
customer care centers and corporate expenses.
Selling, general and administrative expenses decreased by $4.8 million to $1,764.9 million in 2012 and
by $13.6 million to $1,769.7 in 2011. Key components of the net changes in Selling, general and
administrative expenses were as follows:
2012—
• Selling and marketing expenses decreased by $24.8 million, or 3%, primarily from more cost-effective
advertising spending.
• General and administrative expenses increased by $20.1 million, or 2%, driven by increases in bad
debt expense, Federal Universal Service Charge (‘‘FUSC’’) expense and non-income tax expense.
FUSC charges are assessed to customers and also included in Service revenues.
13