US Cellular 2012 Annual Report Download - page 17
Download and view the complete annual report
Please find page 17 of the 2012 US Cellular annual report below. You can navigate through the pages in the report by either clicking on the pages listed below, or by using the keyword search tool below to find specific information within the annual report.-
 1
1 -
2
-
3
-
4
-
5
-
6
-
 7
7 -
 8
8 -
 9
9 -
 10
10 -
 11
11 -
 12
12 -
 13
13 -
 14
14 -
 15
15 -
 16
16 -
 17
17 -
 18
18 -
 19
19 -
 20
20 -
 21
21 -
 22
22 -
 23
23 -
 24
24 -
 25
25 -
 26
26 -
 27
27 -
28
-
29
-
30
-
31
-
32
-
33
-
34
-
35
-
36
-
37
-
38
-
39
-
40
-
41
-
42
-
43
-
44
-
45
-
46
-
47
-
48
-
49
-
50
-
51
-
52
-
53
-
54
-
55
-
56
-
57
-
58
-
59
-
60
-
61
-
62
-
63
-
64
-
65
-
66
-
67
-
68
-
69
-
70
-
71
-
72
-
73
-
74
-
75
-
76
-
77
-
78
-
79
-
80
-
81
-
82
-
83
-
84
-
85
-
86
-
87
-
88
-
89
-
90
-
91
-
92
 |
 |

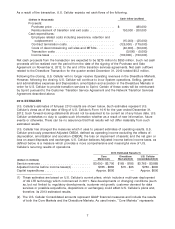
multi-device users among its existing customers, and attracting wireless users switching from other
wireless carriers. U.S. Cellular is focusing on opportunities to increase revenues, pursuing cost reduction
initiatives in various areas and implementing a number of initiatives to enable future growth. The
initiatives are intended, among other things, to allow U.S. Cellular to accelerate its introduction of new
products and services, better segment its customers for new services and retention, sell additional
services such as data, expand its distribution channels, enhance its internet sales and customer service
capabilities, improve its prepaid products and services and reduce operational expenses over the long
term.
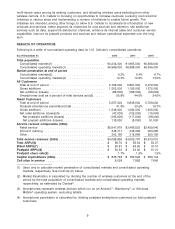
RESULTS OF OPERATIONS
Following is a table of summarized operating data for U.S. Cellular’s consolidated operations.
As of December 31, 2012 2011 2010
Total population
Consolidated markets(1) ............................ 93,244,000 91,965,000 90,468,000
Consolidated operating markets(1) .................... 46,966,000 46,888,000 46,546,000
Market penetration at end of period
Consolidated markets(2) ............................ 6.2% 6.4% 6.7%
Consolidated operating markets(2) .................... 12.3% 12.6% 13.0%
All Customers
Total at end of period .............................. 5,798,000 5,891,000 6,072,000
Gross additions .................................. 1,302,000 1,155,000 1,372,000
Net additions (losses) .............................. (88,000) (186,000) (69,000)
Smartphones sold as a percent of total devices sold(3) ...... 55.8% 44.0% 24.6%
Retail Customers
Total at end of period .............................. 5,557,000 5,608,000 5,729,000
Postpaid smartphone penetration(3)(4) .................. 41.8% 30.5% 16.7%
Gross additions .................................. 1,248,000 1,064,000 1,205,000
Net retail additions (losses)(5) ........................ (47,000) (125,000) (15,000)
Net postpaid additions (losses) ..................... (165,000) (117,000) (66,000)
Net prepaid additions (losses) ...................... 118,000 (8,000) 51,000
Service revenue components (000s)
Retail service .................................... $3,547,979 $3,486,522 $3,459,546
Inbound roaming ................................. 348,717 348,309 253,290
Other .......................................... 202,160 218,966 200,165
Total service revenues (000s) ......................... $4,098,856 $4,053,797 $3,913,001
Total ARPU(6) .................................... $ 58.70 $ 56.54 $ 53.27
Billed ARPU(7) .................................... $ 50.81 $ 48.63 $ 47.10
Postpaid ARPU(8) ................................. $ 54.32 $ 54.00 $ 51.21
Postpaid churn rate(9) .............................. 1.7% 1.5% 1.5%
Capital expenditures (000s) .......................... $ 836,748 $ 782,526 $ 583,134
Cell sites in service ................................ 8,028 7,882 7,645
(1) Used only to calculate market penetration of consolidated markets and consolidated operating
markets, respectively. See footnote (2) below.
(2) Market Penetration is calculated by dividing the number of wireless customers at the end of the
period by the total population of consolidated markets and consolidated operating markets,
respectively, as estimated by Claritas.
(3) Smartphones represent wireless devices which run on an Android, Blackberry, or Windows
Mobile operating system, excluding tablets.
(4) Smartphone penetration is calculated by dividing postpaid smartphone customers by total postpaid
customers.
9