US Cellular 2012 Annual Report Download - page 18
Download and view the complete annual report
Please find page 18 of the 2012 US Cellular annual report below. You can navigate through the pages in the report by either clicking on the pages listed below, or by using the keyword search tool below to find specific information within the annual report.-
 1
1 -
2
-
3
-
4
-
5
-
6
-
7
-
 8
8 -
 9
9 -
 10
10 -
 11
11 -
 12
12 -
 13
13 -
 14
14 -
 15
15 -
 16
16 -
 17
17 -
 18
18 -
 19
19 -
 20
20 -
 21
21 -
 22
22 -
 23
23 -
 24
24 -
 25
25 -
 26
26 -
 27
27 -
 28
28 -
29
-
30
-
31
-
32
-
33
-
34
-
35
-
36
-
37
-
38
-
39
-
40
-
41
-
42
-
43
-
44
-
45
-
46
-
47
-
48
-
49
-
50
-
51
-
52
-
53
-
54
-
55
-
56
-
57
-
58
-
59
-
60
-
61
-
62
-
63
-
64
-
65
-
66
-
67
-
68
-
69
-
70
-
71
-
72
-
73
-
74
-
75
-
76
-
77
-
78
-
79
-
80
-
81
-
82
-
83
-
84
-
85
-
86
-
87
-
88
-
89
-
90
-
91
-
92
 |
 |

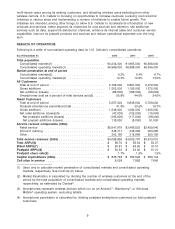
(5) Includes net postpaid additions (losses) and net prepaid additions (losses).
(6) Total ARPU—Average monthly service revenue per customer includes retail service, inbound roaming
and other service revenues and is calculated by dividing total service revenues by the number of
months in the period and by the average total customers during the period.
(7) Billed ARPU—Average monthly billed revenue per customer is calculated by dividing total retail
service revenues by the number of months in the period and by the average total customers during
the period. Retail service revenues include revenues attributable to postpaid, prepaid and reseller
customers.
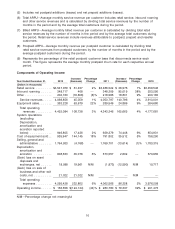
(8) Postpaid ARPU—Average monthly revenue per postpaid customer is calculated by dividing total
retail service revenues from postpaid customers by the number of months in the period and by the
average postpaid customers during the period.
(9) Represents the percentage of the retail postpaid customer base that disconnects service each
month. This figure represents the average monthly postpaid churn rate for each respective annual
period.
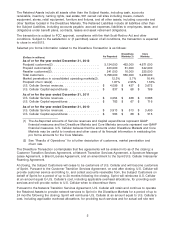
Components of Operating Income
Increase/ Percentage Increase/ Percentage
Year Ended December 31, 2012 (Decrease) Change 2011 (Decrease) Change 2010
(Dollars in thousands)
Retail service ......... $3,547,979 $ 61,457 2% $3,486,522 $ 26,976 1% $3,459,546
Inbound roaming ...... 348,717 408 — 348,309 95,019 38% 253,290
Other ............... 202,160 (16,806) (8)% 218,966 18,801 9% 200,165
Service revenues ..... 4,098,856 45,059 1% 4,053,797 140,796 4% 3,913,001
Equipment sales ....... 353,228 63,679 22% 289,549 24,869 9% 264,680
Total operating
revenues ......... 4,452,084 108,738 3% 4,343,346 165,665 4% 4,177,681
System operations
(excluding
Depreciation,
amortization and
accretion reported
below) ............ 946,805 17,426 2% 929,379 74,448 9% 854,931
Cost of equipment sold . . 935,947 144,145 18% 791,802 35,512 5% 756,290
Selling, general and
administrative ....... 1,764,933 (4,768) — 1,769,701 (13,614) (1)% 1,783,315
Depreciation,
amortization and
accretion .......... 608,633 35,076 6% 573,557 2,602 — 570,955
(Gain) loss on asset
disposals and
exchanges, net ...... 18,088 19,961 N/M (1,873) (12,590) N/M 10,717
(Gain) loss on sale of
business and other exit
costs, net .......... 21,022 21,022 N/M — — N/M —
Total operating
expenses ......... 4,295,428 232,862 6% 4,062,566 86,358 2% 3,976,208
Operating income ...... $ 156,656 $(124,124) (44)% $ 280,780 $ 79,307 39% $ 201,473
N/M—Percentage change not meaningful
10