US Cellular 2012 Annual Report Download - page 10
Download and view the complete annual report
Please find page 10 of the 2012 US Cellular annual report below. You can navigate through the pages in the report by either clicking on the pages listed below, or by using the keyword search tool below to find specific information within the annual report.-
 1
1 -
 2
2 -
 3
3 -
 4
4 -
 5
5 -
 6
6 -
 7
7 -
 8
8 -
 9
9 -
 10
10 -
 11
11 -
 12
12 -
 13
13 -
 14
14 -
 15
15 -
 16
16 -
 17
17 -
 18
18 -
 19
19 -
 20
20 -
 21
21 -
22
-
23
-
24
-
25
-
26
-
27
-
28
-
29
-
30
-
31
-
32
-
33
-
34
-
35
-
36
-
37
-
38
-
39
-
40
-
41
-
42
-
43
-
44
-
45
-
46
-
47
-
48
-
49
-
50
-
51
-
52
-
53
-
54
-
55
-
56
-
57
-
58
-
59
-
60
-
61
-
62
-
63
-
64
-
65
-
66
-
67
-
68
-
69
-
70
-
71
-
72
-
73
-
74
-
75
-
76
-
77
-
78
-
79
-
80
-
81
-
82
-
83
-
84
-
85
-
86
-
87
-
88
-
89
-
90
-
91
-
92
 |
 |
• U.S. Cellular continued its efforts on a number of multi-year initiatives including the development of a
new Billing and Operational Support System (‘‘B/OSS’’) which will include a new point-of-sale system
and consolidate billing on one platform.
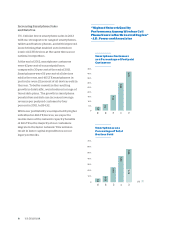
• Retail customer net losses were 47,000 in 2012 compared to net losses of 125,000 in 2011. In the
postpaid category, there were net losses of 165,000 in 2012, compared to net losses of 117,000 in
2011. Prepaid net additions were 118,000 in 2012 compared to net losses of 8,000 in 2011.
• Postpaid customers comprised approximately 92% of U.S. Cellular’s retail customers as of
December 31, 2012. The postpaid churn rate was 1.7% in 2012 and 1.5% in 2011. The prepaid churn
rate was 6.0% in 2012 and 6.6% in 2011.
• Postpaid customers on smartphone service plans increased to 42% as of December 31, 2012
compared to 30% as of December 31, 2011. In addition, smartphones represented 56% of all devices
sold in 2012 compared to 44% in 2011. LTE smartphones represented 40% of all smartphones sold in
2012.
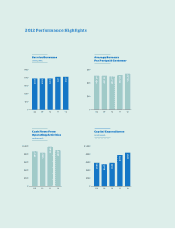
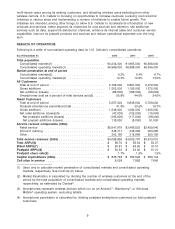
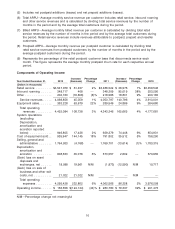
• Retail service revenues of $3,548.0 million increased $61.5 million year-over-year, due to an increase in
average monthly service revenue per customer, partially offset by a decrease of 156,000 in the average
number of customers. Total service revenues of $4,098.9 million increased $45.1 million year-over-year,
primarily due to increases in data and prepaid revenues partially offset by the phase down of ETC
support and the net loss of retail customers.
• Cash flows from operating activities were $899.3 million. At December 31, 2012, Cash and cash
equivalents and Short-term investments totaled $479.0 million and there were no outstanding
borrowings under the revolving credit facility.
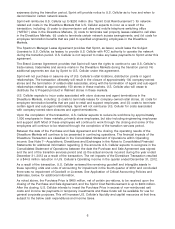
• Additions to Property, plant and equipment totaled $836.7 million, including expenditures to construct
cell sites, increase capacity in existing cell sites and switches, deploy fourth generation Long-term
Evolution (‘‘4G LTE’’) equipment, outfit new and remodel existing retail stores, develop new billing and
other customer management related systems and platforms, and enhance existing office systems. Total
cell sites in service increased by 146, or 2%, year-over-year to 8,028.
• Operating income decreased $124.1 million, or 44%, to $156.7 million in 2012 from $280.8 million in
2011. Higher service revenues as discussed above were offset by higher operating expenses as well
as accelerated depreciation and a loss on disposal of assets related to the Divestiture Transaction.
• Net income attributable to U.S. Cellular shareholders decreased $64 million, or 37%, to $111.0 million
in 2012 compared to $175.0 million in 2011, primarily due to lower operating income. Basic earnings
per share was $1.31 in 2012, which was $0.75 lower than in 2011, and Diluted earnings per share was
$1.30, which was $0.75 lower than in 2011.
U.S. Cellular anticipates that future results will be affected by the following factors:
– Impacts of the Divestiture Transaction including, but not limited to, the ability to obtain regulatory
approval, successfully complete the transaction and the actual financial impacts of such transaction;
– Relative ability to attract and retain customers in a competitive marketplace in a cost effective
manner;
– Effects of industry competition on service and equipment pricing and roaming revenues as well as
the impacts associated with the expanding presence of carriers and other retailers offering
low-priced, unlimited prepaid service;
– Expanded distribution of products and services, such as U Prepaid and postpaid plans, in third-party
national retailers;
– Potential increases in prepaid customers, who generally generate lower average revenue per user
(‘‘ARPU’’), as a percentage of U.S. Cellular’s customer base in response to changes in customer
preferences and industry dynamics;
2