US Cellular 2012 Annual Report Download - page 25
Download and view the complete annual report
Please find page 25 of the 2012 US Cellular annual report below. You can navigate through the pages in the report by either clicking on the pages listed below, or by using the keyword search tool below to find specific information within the annual report.-
 1
1 -
2
-
3
-
4
-
5
-
6
-
7
-
8
-
9
-
10
-
11
-
12
-
13
-
14
-
 15
15 -
 16
16 -
 17
17 -
 18
18 -
 19
19 -
 20
20 -
 21
21 -
 22
22 -
 23
23 -
 24
24 -
 25
25 -
 26
26 -
 27
27 -
 28
28 -
 29
29 -
 30
30 -
 31
31 -
 32
32 -
 33
33 -
 34
34 -
 35
35 -
36
-
37
-
38
-
39
-
40
-
41
-
42
-
43
-
44
-
45
-
46
-
47
-
48
-
49
-
50
-
51
-
52
-
53
-
54
-
55
-
56
-
57
-
58
-
59
-
60
-
61
-
62
-
63
-
64
-
65
-
66
-
67
-
68
-
69
-
70
-
71
-
72
-
73
-
74
-
75
-
76
-
77
-
78
-
79
-
80
-
81
-
82
-
83
-
84
-
85
-
86
-
87
-
88
-
89
-
90
-
91
-
92
 |
 |
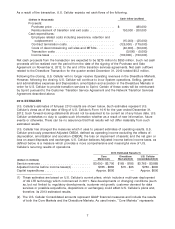
Cellular expects federal income tax payments to substantially increase beginning in 2014 and remain
at a higher level for several years as the amount of U.S. Cellular’s federal tax depreciation deduction
substantially decreases as a result of having accelerated depreciation in earlier years. This expectation
considers the bonus depreciation provisions enacted in January 2013, which includes 50% federal tax
bonus depreciation on qualified capital expenditures in the 2013 tax year and assumes that federal
bonus depreciation provisions are not enacted in future periods. To the extent further federal bonus
depreciation provisions are enacted, this expectation will change.
• Changes in Accounts receivable combined with the impact of Bad debts expense provided $2.6 million
in 2012 and required $20.0 million in 2011, resulting in a year-over-year increase in cash flows of
$22.6 million. Accounts receivable balances fluctuate based on the timing of customer payments,
promotions and other factors.
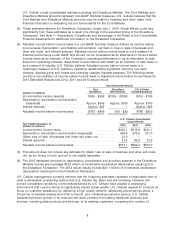
• Changes in Inventory required $28.8 million in 2012 and required $14.6 million in 2011, resulting in a
$14.2 million decrease in cash flows. This change was primarily due to higher inventory levels and a
change in inventory mix resulting in a higher cost per unit.
• Changes in Accounts payable required $6.4 million in 2012 and provided $29.8 million in 2011,
causing a year-over-year decrease in cash flows of $36.2 million. Changes in Accounts payable were
primarily driven by payment timing differences related to network equipment and device purchases.
• Changes in other assets and liabilities required $27.7 million and $3.3 million in 2012 and 2011,
respectively, causing a year-over-year decrease in cash flows of $24.4 million. This change was
primarily due to an increase in LTE-related deferred charges.
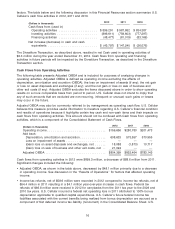
Cash flows from operating activities in 2011 were $987.9 million, an increase of $153.5 million from 2010.
Significant changes included the following:
• Adjusted OIBDA, as shown in the table above, increased by $69.3 million primarily due to a decrease
in operating income. See discussion in the ‘‘Results of Operations’’ for factors that affected operating
income.
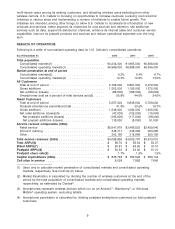
• Income tax refunds, net of $54.4 million were recorded in 2011 compared to income tax payments, net
of $53.1 million in 2010 resulting in a $107.5 million year-over-year increase in cash flows. Tax refunds
received in 2011 primarily represented federal refunds related to the 2010 tax year.
• Changes in Inventory required $14.6 million in 2011 and provided $40.3 million in 2010, resulting in a
$54.9 million decrease in cash flows. This change was primarily due to higher inventory levels and a
change in inventory mix resulting in a higher cost per unit.
• Changes in Accounts payable provided $29.8 million in 2011 and required $56.5 million in 2010,
causing a year-over-year increase in cash flows of $86.3 million. Changes in Accounts payable were
primarily driven by payment timing differences related to network equipment and device purchases.
• Changes in Customer deposits and deferred revenues provided $34.9 million and $6.2 million in 2011
and 2010, respectively, resulting in a year-over-year increase in cash flows of $28.7 million. This
change was primarily driven by deferred revenues related to the loyalty reward program.
• Changes in Other assets and liabilities required $3.3 million and provided $77.6 million in 2011 and
2010, respectively, causing a year-over-year net decrease in cash flows of $80.8 million. In 2009, a
$34.0 million deposit was paid to TDS for U.S. Cellular’s proportionate share of a deposit TDS made to
the Internal Revenue Service (‘‘IRS’’) to eliminate any potential interest due to the IRS subsequent to
the date of the deposit. In 2010, after closure of the IRS audit for the tax years 2002 through 2005, the
IRS returned TDS’ $38.0 million deposit, of which TDS returned $34.0 million to U.S. Cellular,
representing U.S. Cellular’s proportionate share. This $34.0 million was included in Change in other
assets and liabilities in 2010 as a cash inflow. Changes in amounts due to agents and accrued rebates
were the primary cause of the remaining $46.8 million year-over-year change in Other assets and
liabilities.
17