US Cellular 2012 Annual Report Download - page 22
Download and view the complete annual report
Please find page 22 of the 2012 US Cellular annual report below. You can navigate through the pages in the report by either clicking on the pages listed below, or by using the keyword search tool below to find specific information within the annual report.-
 1
1 -
2
-
3
-
4
-
5
-
6
-
7
-
8
-
9
-
10
-
11
-
 12
12 -
 13
13 -
 14
14 -
 15
15 -
 16
16 -
 17
17 -
 18
18 -
 19
19 -
 20
20 -
 21
21 -
 22
22 -
 23
23 -
 24
24 -
 25
25 -
 26
26 -
 27
27 -
 28
28 -
 29
29 -
 30
30 -
 31
31 -
 32
32 -
33
-
34
-
35
-
36
-
37
-
38
-
39
-
40
-
41
-
42
-
43
-
44
-
45
-
46
-
47
-
48
-
49
-
50
-
51
-
52
-
53
-
54
-
55
-
56
-
57
-
58
-
59
-
60
-
61
-
62
-
63
-
64
-
65
-
66
-
67
-
68
-
69
-
70
-
71
-
72
-
73
-
74
-
75
-
76
-
77
-
78
-
79
-
80
-
81
-
82
-
83
-
84
-
85
-
86
-
87
-
88
-
89
-
90
-
91
-
92
 |
 |

2011—
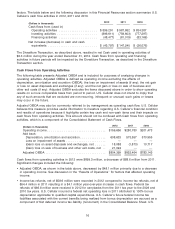
• Selling and marketing expenses decreased by $13.7 million, or 2%, primarily due to lower advertising
costs as a result of shifting advertising efforts to more cost effective methods as well as lower
commissions expense reflecting fewer eligible transactions.
• General and administrative expenses were relatively flat year over year.
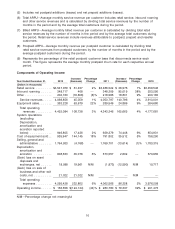
Depreciation, amortization and accretion
Depreciation, amortization and accretion expense increased $35.1 million in 2012, or 6% primarily due to
the acceleration of depreciation in the Divestiture Markets and depreciation and amortization on asset
additions.
(Gain) loss on asset disposals and exchanges, net
(Gain) loss on asset disposals and exchanges, net was a loss of $18.1 million in 2012 primarily due to
losses resulting from the write-off of certain network assets.
(Gain) loss on sale of business and other exit costs, net
(Gain) loss on sale of business and other exit costs, net was a loss of $21.0 million in 2012. This loss is
primarily due to employee severance costs and asset write-offs in the Divestiture Markets, partially offset
by a $4.2 million gain resulting from the sale of a wireless market in March 2012.
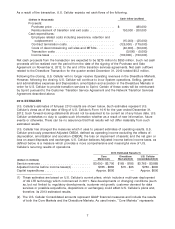
See ‘‘Financial Resources’’ and ‘‘Liquidity and Capital Resources’’ for a discussion of U.S. Cellular’s
capital expenditures.
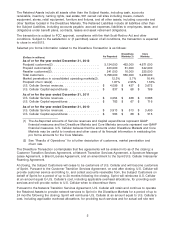
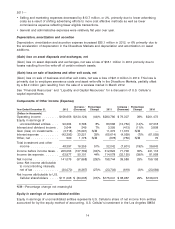
Components of Other Income (Expense)
Increase / Percentage Increase / Percentage
Year Ended December 31, 2012 (Decrease) Change 2011 (Decrease) Change 2010
(Dollars in thousands)
Operating income .........$156,656 $(124,124) (44)% $280,780 $ 79,307 39% $201,473
Equity in earnings of
unconsolidated entities .... 90,364 6,798 8% 83,566 (13,752) (14)% 97,318
Interest and dividend income . 3,644 249 7% 3,395 (413) (11)% 3,808
Gain (loss) on investments . . . (3,718) (15,091) N/M 11,373 11,373 N/M —
Interest expense .......... (42,393) 23,221 35% (65,614) (4,059) (7)% (61,555)
Other, net ............... 500 1,178 N/M (678) (750) N/M 72
Total investment and other
income ............... 48,397 16,355 51% 32,042 (7,601) (19)% 39,643
Income before income taxes . . 205,053 (107,769) (34)% 312,822 71,706 30% 241,116
Income tax expense ........ 63,977 50,101 44% 114,078 (32,120) (39)% 81,958
Net income .............. 141,076 (57,668) (29)% 198,744 39,586 25% 159,158
Less: Net income attributable
to noncontrolling interests,
net of tax .............. (30,070) (6,367) (27)% (23,703) (619) (3)% (23,084)
Net income attributable to U.S.
Cellular shareholders .....$111,006 $ (64,035) (37)% $175,041 $ 38,967 29% $136,074
N/M—Percentage change not meaningful
Equity in earnings of unconsolidated entities
Equity in earnings of unconsolidated entities represents U.S. Cellular’s share of net income from entities
accounted for by the equity method of accounting. U.S. Cellular’s investment in the Los Angeles SMSA
14