Spirit Airlines 2014 Annual Report Download - page 88
Download and view the complete annual report
Please find page 88 of the 2014 Spirit Airlines annual report below. You can navigate through the pages in the report by either clicking on the pages listed below, or by using the keyword search tool below to find specific information within the annual report.-
 1
1 -
2
-
3
-
4
-
5
-
6
-
7
-
8
-
9
-
10
-
11
-
12
-
13
-
14
-
15
-
16
-
17
-
18
-
19
-
20
-
21
-
22
-
23
-
24
-
25
-
26
-
27
-
28
-
29
-
30
-
31
-
32
-
33
-
34
-
35
-
36
-
37
-
38
-
39
-
40
-
41
-
42
-
43
-
44
-
45
-
46
-
47
-
48
-
49
-
50
-
51
-
52
-
53
-
54
-
55
-
56
-
57
-
58
-
59
-
60
-
61
-
62
-
63
-
64
-
65
-
66
-
67
-
68
-
69
-
70
-
71
-
72
-
73
-
74
-
75
-
76
-
77
-
 78
78 -
 79
79 -
 80
80 -
 81
81 -
 82
82 -
 83
83 -
 84
84 -
 85
85 -
 86
86 -
 87
87 -
 88
88 -
 89
89 -
 90
90 -
 91
91 -
 92
92 -
 93
93 -
 94
94 -
 95
95 -
 96
96 -
 97
97 -
 98
98 -
99
 |
 |

Notes to Financial Statements—(Continued)
88
The Company's Valuation Group is made up of individuals from the Company's Treasury and Corporate Accounting
departments. The Valuation Group is responsible for the Company's valuation policies, procedures and execution thereof. The
Company's Valuation Group reports to the Company's Chief Financial Officer and seeks approval for certain derivative
transactions from the Audit Committee. The Valuation Group compares the results of the Company's internally developed
valuation methods with counterparty reports at each balance sheet date and assesses the Company's valuation methods for
accurateness and identifies any needs for modification.
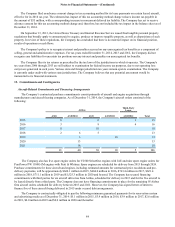
The following table presents the Company’s activity for assets and liabilities measured at gross fair value on a recurring
basis using significant unobservable inputs (Level 3):
Jet Fuel Options
(in millions)
Balance at January 1, 2012 . . . . . . . . . . . . . . . . . . . . . . . . . . . . . . . . . . . . . . . . . . . . . . . . $ 0.3
Total realized or unrealized gains (losses) included in earnings, net . . . . . . . . . . . . . (0.2)
Purchases . . . . . . . . . . . . . . . . . . . . . . . . . . . . . . . . . . . . . . . . . . . . . . . . . . . . . . . . . . —
Sales . . . . . . . . . . . . . . . . . . . . . . . . . . . . . . . . . . . . . . . . . . . . . . . . . . . . . . . . . . . . . . —
Settlements, net. . . . . . . . . . . . . . . . . . . . . . . . . . . . . . . . . . . . . . . . . . . . . . . . . . . . . . 0.2
Balance at December 31, 2012 . . . . . . . . . . . . . . . . . . . . . . . . . . . . . . . . . . . . . . . . . . . . . 0.3
Total realized or unrealized gains (losses) included in earnings, net . . . . . . . . . . . . . 0.1
Purchases —
Sales . . . . . . . . . . . . . . . . . . . . . . . . . . . . . . . . . . . . . . . . . . . . . . . . . . . . . . . . . . . . . . —
Settlements, net. . . . . . . . . . . . . . . . . . . . . . . . . . . . . . . . . . . . . . . . . . . . . . . . . . . . . . (0.4)
Balance at December 31, 2013 . . . . . . . . . . . . . . . . . . . . . . . . . . . . . . . . . . . . . . . . . . . . . —
Total realized or unrealized gains (losses) included in earnings, net . . . . . . . . . . . . . (4.9)
Purchases . . . . . . . . . . . . . . . . . . . . . . . . . . . . . . . . . . . . . . . . . . . . . . . . . . . . . . . . . . 9.7
Sales . . . . . . . . . . . . . . . . . . . . . . . . . . . . . . . . . . . . . . . . . . . . . . . . . . . . . . . . . . . . . . —
Settlements, net. . . . . . . . . . . . . . . . . . . . . . . . . . . . . . . . . . . . . . . . . . . . . . . . . . . . . . —
Balance at December 31, 2014 . . . . . . . . . . . . . . . . . . . . . . . . . . . . . . . . . . . . . . . . . . . . . $ 4.8
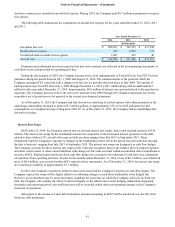
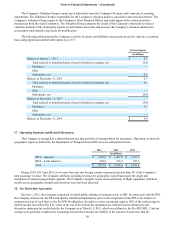
17. Operating Segments and Related Disclosures
The Company is managed as a single business unit that provides air transportation for passengers. Operating revenues by
geographic region as defined by the Department of Transportation (DOT) area are summarized below:
2014 2013 2012
(in millions)
DOT—domestic . . . . . . . . . . . . . . . . . . . . . . . . . $ 1,728.8 $ 1,467.5 $ 1,135.1
DOT—Latin America . . . . . . . . . . . . . . . . . . . . . 202.8 186.9 183.3
Total. . . . . . . . . . . . . . . . . . . . . . . . . . . . . . . . . . . $ 1,931.6 $ 1,654.4 $ 1,318.4
During 2014, 2013 and 2012, no revenue from any one foreign country represented greater than 4% of the Company’s
total passenger revenue. The Company attributes operating revenues by geographic region based upon the origin and
destination of each passenger flight segment. The Company’s tangible assets consist primarily of flight equipment, which are
mobile across geographic markets and, therefore, have not been allocated.
18. Tax Receivable Agreement
On June 1, 2011, the Company completed its initial public offering of common stock, or IPO. In connection with the IPO,
the Company entered into the TRA and thereby distributed immediately prior to the completion of the IPO to the holders of
common stock as of such time, or the Pre-IPO Stockholders, the right to receive an amount equal to 90% of the cash savings in
federal income tax realized by it by virtue of the use of the federal net operating loss, deferred interest deductions and
alternative minimum tax credits held by the Company as of March 31, 2011, which was defined as the Pre-IPO NOL. Cash tax
savings were generally computed by comparing actual federal income tax liability to the amount of such taxes that the