Spirit Airlines 2014 Annual Report Download - page 45
Download and view the complete annual report
Please find page 45 of the 2014 Spirit Airlines annual report below. You can navigate through the pages in the report by either clicking on the pages listed below, or by using the keyword search tool below to find specific information within the annual report.-
 1
1 -
2
-
3
-
4
-
5
-
6
-
7
-
8
-
9
-
10
-
11
-
12
-
13
-
14
-
15
-
16
-
17
-
18
-
19
-
20
-
21
-
22
-
23
-
24
-
25
-
26
-
27
-
28
-
29
-
30
-
31
-
32
-
33
-
34
-
 35
35 -
 36
36 -
 37
37 -
 38
38 -
 39
39 -
 40
40 -
 41
41 -
 42
42 -
 43
43 -
 44
44 -
 45
45 -
 46
46 -
 47
47 -
 48
48 -
 49
49 -
 50
50 -
 51
51 -
 52
52 -
 53
53 -
 54
54 -
 55
55 -
56
-
57
-
58
-
59
-
60
-
61
-
62
-
63
-
64
-
65
-
66
-
67
-
68
-
69
-
70
-
71
-
72
-
73
-
74
-
75
-
76
-
77
-
78
-
79
-
80
-
81
-
82
-
83
-
84
-
85
-
86
-
87
-
88
-
89
-
90
-
91
-
92
-
93
-
94
-
95
-
96
-
97
-
98
-
99
 |
 |

45
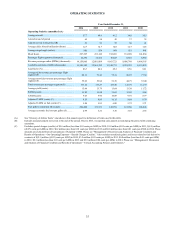
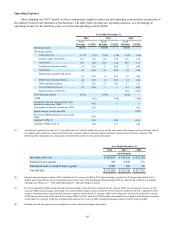
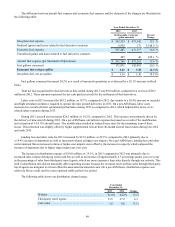
Operating Expenses
Since adopting our ULCC model, we have continuously sought to reduce our unit operating costs and have created one of
the industry's lowest cost structures in the Americas. The table below presents our operating expenses, as a percentage of
operating revenue for the last three years, as well as unit operating costs (CASM).
Year Ended December 31,
2014 2013 2012
% of
Revenue CASM % of
Revenue CASM % of
Revenue CASM
Operating revenue 100.0% 100.0% 100.0%
Operating expenses:
Aircraft fuel (1) . . . . . . . . . . . . . . . . . . 31.7% 3.75¢ 33.4% 3.98¢ 35.8% 4.16¢
Salaries, wages and benefits. . . . . . . . . 16.3 1.92 15.8 1.89 16.6 1.93
Aircraft rent . . . . . . . . . . . . . . . . . . . . . 10.1 1.20 10.3 1.22 10.9 1.27
Landing fees and other rentals . . . . . . . 5.4 0.64 5.1 0.60 5.2 0.60
Distribution. . . . . . . . . . . . . . . . . . . . . . 3.9 0.46 4.1 0.49 4.3 0.50
Maintenance, materials and repairs . . . 3.8 0.45 3.6 0.43 3.8 0.44
Depreciation and amortization . . . . . . . 2.4 0.29 1.9 0.23 1.2 0.13
Other operating expenses . . . . . . . . . . . 7.7 0.92 8.7 1.04 9.7 1.13
Loss on disposal of assets. . . . . . . . . . . 0.2 0.02 — — 0.1 0.01
Special charges (credits) (2). . . . . . . . . — — — — (0.6) (0.07)
Total operating expense 81.6% 82.9% 86.8%
CASM . . . . . . . . . . . . . . . . . . . . . . . . . . . . . . 9.65¢ 9.90¢ 10.09¢
Unrealized gains and losses related to fuel
derivative contracts per ASM . . . . . . . . . . . . 0.02 — —
Loss (gains) on disposal of assets per ASM . 0.02 — 0.01
Special charges (credits) per ASM — — (0.07)
Prior years' additional federal excise tax per
ASM 0.06 — —
Adjusted CASM (3) 9.55 9.89 10.15
Adjusted CASM ex fuel (4) 5.88 5.91 6.00
(1) Aircraft fuel expense is the sum of (i) “into-plane fuel cost,” which includes the cost of jet fuel and certain other charges such as fuel taxes and oil,
(ii) realized gains and losses related to fuel derivative contracts and (iii) unrealized gains and losses related to fuel derivative contracts. The
following table summarizes the components of aircraft fuel expense for the periods presented:
Year Ended December 31,
2014 2013 2012
(in thousands)
Into-plane fuel cost . . . . . . . . . . . . . . . . . . . . . . . . . . . . . . . . . . . $ 608,033 $ 542,523 $ 471,542
Realized losses (gains) . . . . . . . . . . . . . . . . . . . . . . . . . . . . . . . . 995 8,958 175
Unrealized mark-to-market losses (gains) . . . . . . . . . . . . . . . . . 3,881 265 46
Aircraft fuel. . . . . . . . . . . . . . . . . . . . . . . . . . . . . . . . . . . . . . . . . $ 612,909 $ 551,746 $ 471,763
(2) Includes special charges (credits) of $(8.5) million ((0.07) cents per ASM) in 2012. Special charges (credits) for 2012 primarily include a $9.1
million gain related to the sale of four permanent air carrier slots at Ronald Reagan National Airport (DCA), offset by $0.6 million in secondary
offering costs. Please see “—Our Operating Expenses—Special Charges (Credits).”
(3) For 2014, adjusted CASM excludes unrealized losses related to fuel derivative contracts of 0.02 cent per ASM, loss on disposal of assets of 0.02
cents per ASM, special charges of less than 0.01 cent per ASM, and prior year jet fuel FET of 0.06 cents per ASM. For the 2013, adjusted CASM
excludes unrealized losses related to fuel derivative contracts of less than 0.01 cents per ASM, loss on disposal of assets of less than 0.01 cent per
ASM, and special charges of less than 0.01 cent per ASM. For 2012, adjusted CASM excludes unrealized losses related to fuel derivative contracts
of less than 0.01 cents per ASM, loss on disposal of assets of 0.01 cent per ASM, and special charges (credits) of (0.07) cent per ASM.
(4) Excludes aircraft fuel expense, loss on disposal of assets, and special charges and credits.